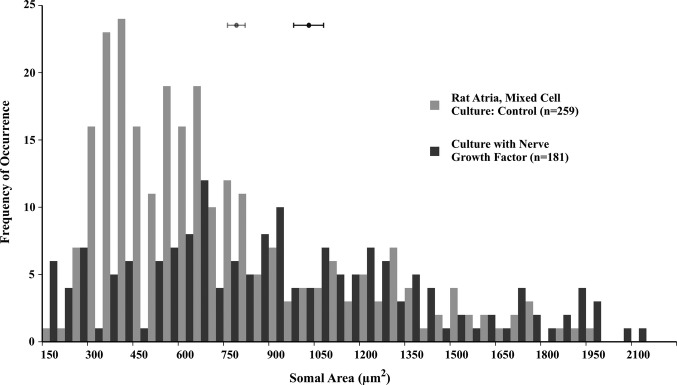
Figure 7.

Somal area of neurons in rat atria, mixed cell cultures (light gray), and similar cultures incubated with nerve growth factor (2 mg/mL, dark gray); each bin represents 50 μm2. The distribution histogram for rat atrial neurons cultured with nerve growth factor is shifted significantly toward larger sizes compared with that for neurons from normal control cultures (1005.78±50.48 versus 711.63±29.71 μm2; P<0.01).
