
Figure 1.
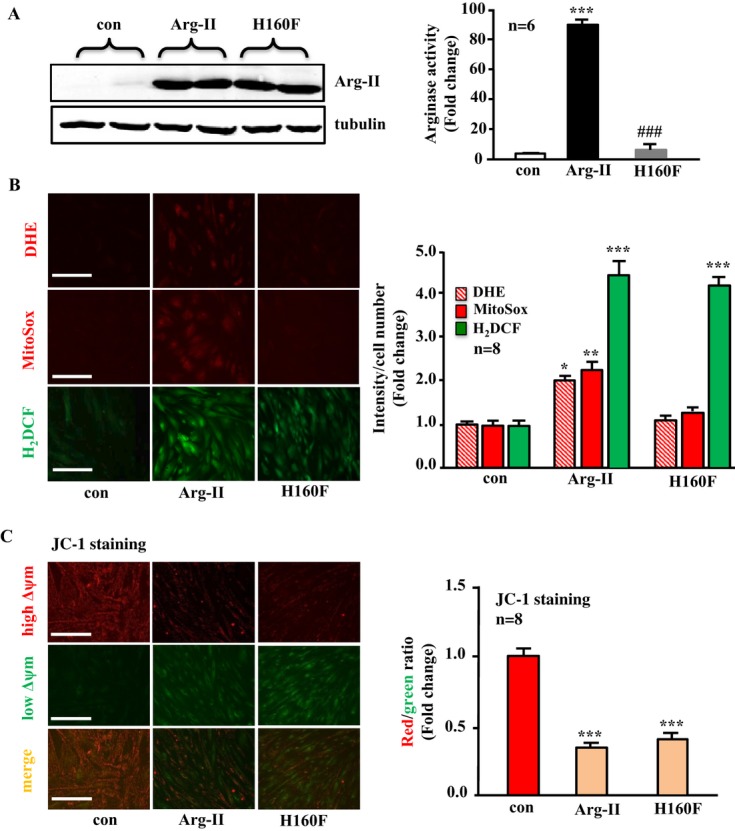
Arginase‐II (Arg‐II) overexpression enhances cytoplasmic and mitochondrial O2•− generation in an l‐arginine ureahydrolase activity‐dependent manner, promotes production of H2O2, and decreases mitochondrial membrane potential (Δψm) independently of its enzymatic activity in young VSMCs. Young VSMCs were transduced with empty vector rAd/CMV as control (con), rAd/CMV‐Arg‐II (Arg‐II), or rAd/CMV‐Arg‐II‐H160F (H160F, an inactive Arg‐II mutant). Seventy‐two hours posttransduction, the cells were subjected to (A) immunoblotting analysis for detection of overexpressed Arg‐II taking tubulin as a loading control (left) and arginase activity assay (right). B, DHE and MitoSox staining for detection of cytoplasmic and mitochondrial O2•−, respectively, and H2DCF staining for detection of H2O2 production. C, Δψm assessment using a JC‐1 Mitochondrial Membrane Potential Detection Kit. Red fluorescence JC‐1 signal is indicative of healthy cells with high Δψm, whereas green fluorescence JC‐1 signal is indicative of unhealthy cells with low Δψm. Quantification of the signals is shown in the corresponding right‐sided panels (n=6 or 8 as indicated in the graphs). **P<0.01, ***P<0.001 vs control group, ###P<0.001 vs Arg‐II. Scale bar=0.2 mm. VSMC indicates vascular smooth muscle cell; rAd, recombinant adenovirus; DHE, dihydroethidium; H2DCF, 2′,7′‐dichlorofluorescein; CMV, cytomegalovirus.