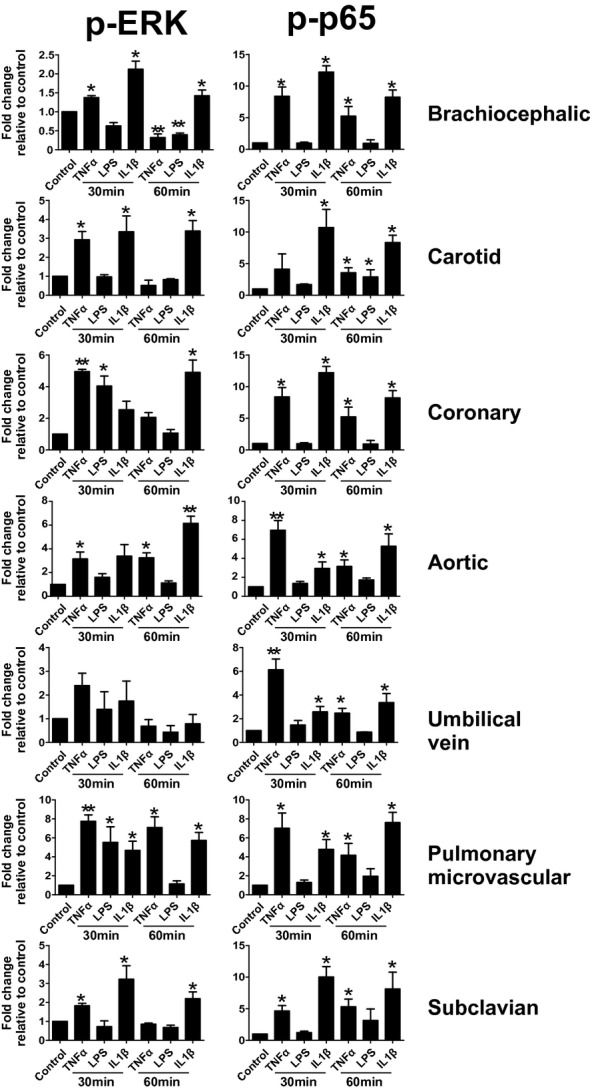
Figure 2.

ERK and p65 phosphorylation in endothelial cells from different vascular beds. Endothelial cells were left untreated or treated with TNF‐α (10 ng/mL), LPS (100 ng/mL), or IL‐1β (2.5 ng/mL) for 30 or 60 minutes. Lysates were analyzed by Western blot analysis for the expression of p‐ERK (T202,Y204), ERK, p65 (S536), or p‐p65. Western blot data were analyzed by Image J. Data are mean±SEM (n=3). *P<0.05 and **P<0.01 vs control by a single 1‐way ANOVA with Tukey posttest. TNF‐α indicates tumor necrosis factor–α; LPS, lipopolysaccharide; IL‐1β, interleukin‐1β; SEM, standard error of the mean; ANOVA, analysis of variance.
