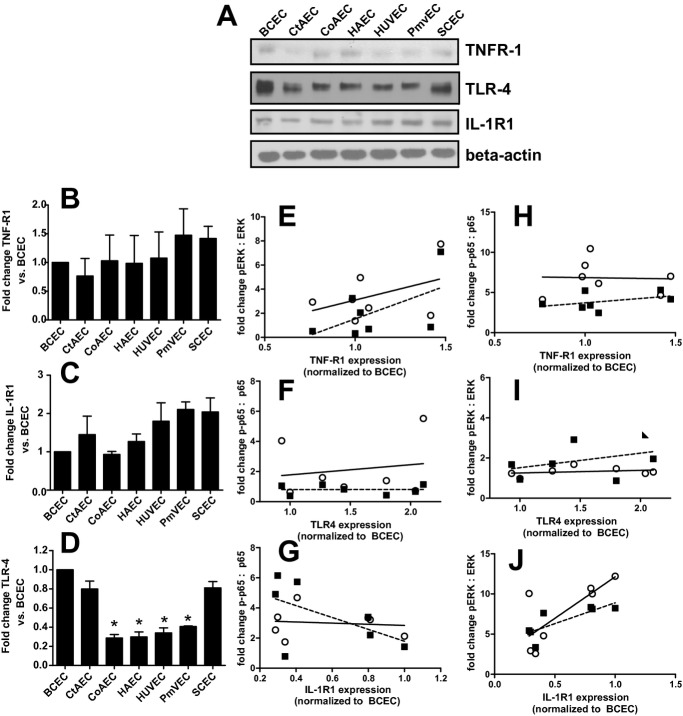
Figure 3.
Basal expression of TNFR1, IL1‐R1, and TLR4 among different endothelial cells. A, Representative Western blots for basal expression of indicated receptors. B, C, and D, Quantitation of Western blots in A. Data are mean±SEM (n=3). *P<0.01 relative to BCECs, CtAECs, and SCECs by 1‐way ANOVA with Tukey posttest. E, F, and G, Correlations between the degree of ERK activation (normalized to basal levels for each cell type), on the y axis, for TNF‐α, IL‐1β, and LPS, respectively, vs basal expression of TNFR1, IL1‐R1, and TLR4 (x axis), respectively. Receptor expression is shown relative to level in BCECs. H, I, J, Correlations between the degree of p65 activation (normalized to basal levels for each cell type), on the y axis, for TNF‐α, IL‐1β, and LPS, respectively, vs basal expression of TNFR1, IL1‐R1, and TLR4 (x axis), respectively. Data for signaling molecule activation for 30 minutes (○) and 60 minutes (■) post stimulation are shown. Lines show linear regression fits for 30‐minute (—) and 60‐minute (‐ ‐ ‐) data. No correlations were significant (P>0.05) except for J data, which was P<0.05 by linear regression for the 30‐ and 60‐minute data with y=10.3x+1.8 and y=5.2x+3.7 for the 30‐ and 60‐minute data, respectively. TNFR1 indicates tumor necrosis factor–α receptor 1; IL1‐R1, interleukin‐1β receptor 1; SEM, standard error of the mean; BCECs, brachiocephalic artery endothelial cells; CtAECs, carotid artery endothelial cells; SCECs, subclavian artery endothelial cells; ANOVA, analysis of variance; LPS, lipopolysaccharide; HAECs, human aortic endothelial cells; HUVECs, human umbilical vein endothelial cells; PmvECs, pulmonary microvascular endothelial cells; TLF4, toll‐like receptor 4.

