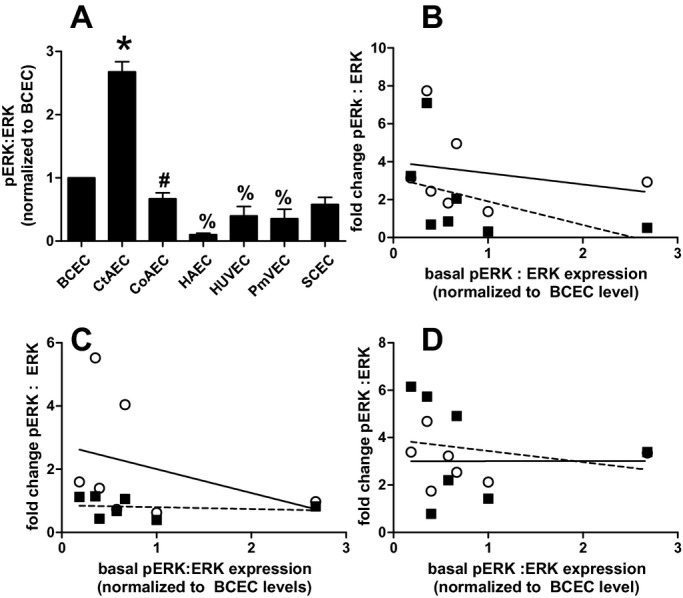
Figure 4.

Basal expression of pERK:ERK ratio in different endothelial cells. A, Quantitation of pERK:ERK ratios under basal conditions in different endothelial cells normalized to ratio in BCECs. Data are mean±SEM (n=3). *P<0.01 vs all other cell types, #P<0.05 vs HAECs and %P<0.05 vs BCECs by 1‐way ANOVA with Tukey posttest. B, C, D, Correlations between the degree of ERK activation (normalized to basal levels for each cell type), on the y axis, for TNF‐α, LPS, or IL‐1β, respectively, vs basal expression of the p‐ERK:ERK ratio normalized to the level in BCECs. Data for signaling molecule activation for 30 minutes (○) and 60 minutes (■) poststimulation are shown. Lines show linear regression fits for 30‐minuts (—) and 60‐minute (‐ ‐ ‐) data. No significant correlations were observed. BCECs indicates brachiocephalic artery endothelial cells; CtAECs, carotid artery endothelial cells; SCECs, subclavian artery endothelial cells; HAECs, human aortic endothelial cells; HUVECs, human umbilical vein endothelial cells; PmvECs, pulmonary microvascular endothelial cells; ANOVA, analysis of variance; SEM, standard error of the mean; TNF‐α, tumor necrosis factor–α; LPS, lipopolysaccharide; IL‐1β, interleukin‐1β.
