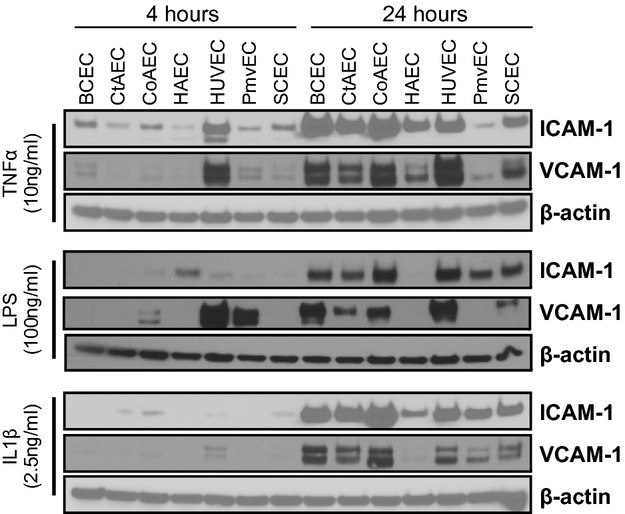
Figure 6.

Comparative Western blot analysis of adhesion molecule expression in stimulated endothelial cells. Endothelial cells were stimulated with TNF‐α (10 ng/mL), LPS (100 ng/mL), or IL‐1β (2.5 ng/mL) for 4 or 24 hours. Lysates were resolved for Western blot analysis of ICAM‐1, VCAM‐1, and β‐actin. Blots shown are representative from 3 experiments. TNF‐α indicates tumor necrosis factor–α; LPS, lipopolysaccharide; IL‐1β, interleukin‐1β; ICAM‐1, intracellular adhesion molecule–1; VCAM‐1, vascular cell adhesion molecule–1; BCECs, brachiocephalic artery endothelial cells; CtAECs, carotid artery endothelial cells; CoAECs, coronary artery endothelial cells; HAECs, human aortic endothelial cells; HUVECs, human umbilical vein endothelial cells; PmvECs, pulmonary microvascular endothelial cells; SCECs, subclavian artery endothelial cells.
