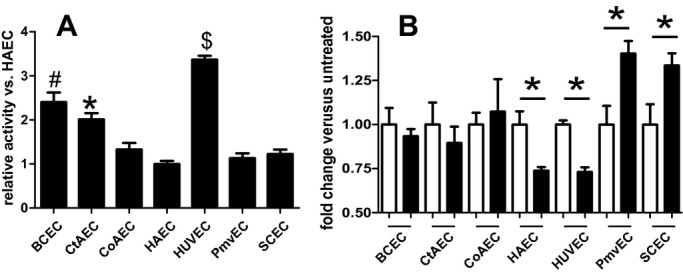
Figure 11.

α‐Mannosidase activity in endothelial cells from different vascular beds. A, Basal α‐mannosidase activity levels were measured as described in the Methods section. B, Endothelial cells were left untreated (□) or stimulated (■) with TNF‐α (10 ng/mL, 24 hours), and α‐mannosidase activity was determined. A, $P<0.05 vs all other cells tested, #P<0.05 vs all cells tested, and *P<0.05 vs all cells tested. B, *P<0.05 vs untreated control. All statistical analysis by single 1‐way ANOVA with Tukey posttest (n=4 to 6 for each condition). Data are mean±SEM. TNF‐α indicates tumor necrosis factor–α; ANOVA, analysis of variance; SEM, standard error of the mean.
