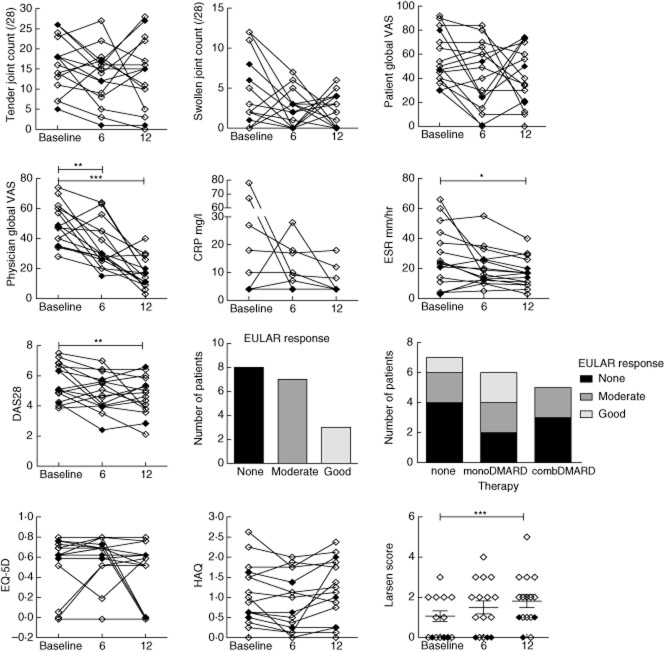
Fig. 3.
Changes in clinical measures over 1 year of follow-up in early inflammatory arthritis (EIA). Sixteen patients had complete data available for visits at baseline, 6 and 12 months. Symbols and lines represent individual patients. Changes over time were analysed using repeated-measures analysis of variance (anova) with Bonferroni post-test versus baseline. Patients classified as rheumatoid arthritis (RA) are shown by open symbols and undifferentiated arthritis (UA) by closed symbols. *P < 0·05; **P < 0·01; ***P < 0·001.

