Fig. 2.
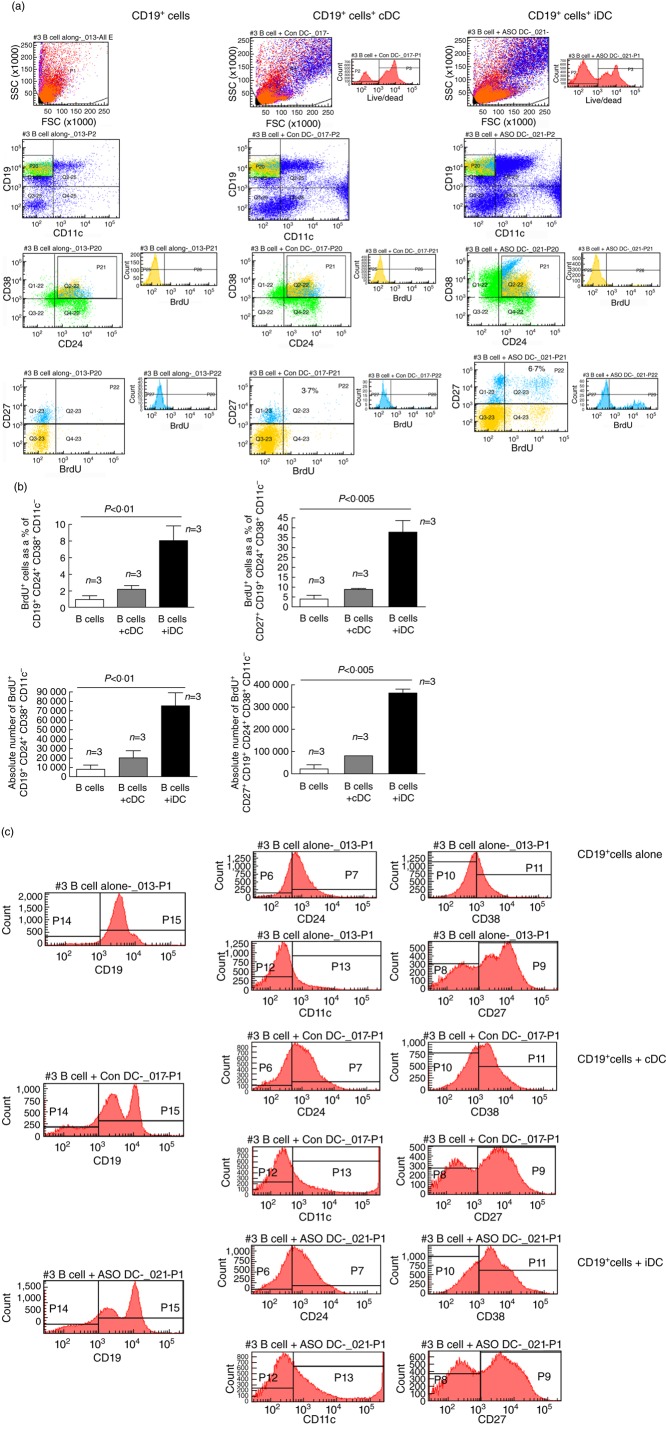
The frequency and absolute cell numbers of suppressive B cells is increased in co-culture with control DC (cDC) and immunosuppressive DC (iDC) in vitro. (a) Flow cytometry was conducted as shown. The frequency of human suppressive B cells (CD19+CD24+CD38+CD27+/–) measured after a 2-day co-culture of thawed normal human donor peripheral blood mononuclear cells (PBMC) with autologous cDC or iDC generated from the same PBMC donor. The quadrant plots at the top of the figure show the frequency of CD19+CD11c– cells as a percentage of total viable cells in culture. The quadrant plots in the lower middle of the figure show the CD24+CD38+/intermediate cell frequency as a percentage of CD19+CD11c– cells. The quadrant plots and histograms at the bottom serve to distinguish whether the differences in the frequencies of the B cells analysed in the preceding quadrants are due to changes in the expression of single surface molecules (CD27) or to proliferative/differentiation events [5-bromo-2-deoxyuridine (BrdU)+] in response to provision of the DC in the co-culture. These data are representative of the outcome of triplicate co-cultures on at least two independent occasions using PBMC from two unrelated healthy adults. The events coloured green represent the CD38+CD24+ cells inside the CD19+CD11c– parental population. The events in yellow represent the BrdU+ cells and the events in light blue represent the CD27+ cells. (b) A graphical summary of the frequency (upper graphs) and the absolute number (lower graphs) of CD19+CD24+CD38+CD11c– B cells detected in 2- day co-cultures of freshly collected PBMC and control DC (cDC) or immunosuppressive DC (iDC). The graphs at the top summarize the frequency of proliferative (BrdU) cells as a percentage of CD19+CD24+CD38+CD11c– B cells (top left) and as a percentage of CD27+CD19+CD24+CD38+CD11c– B cells (top right). The graphs at the bottom summarize the absolute cell numbers of CD19+CD24+CD38+CD11c– B cells (bottom left) and of CD27+CD19+CD24+CD38+CD11c– B cells (bottom right). The bars in the graphs show the mean of triplicate co-cultures and the error bars the standard error of the mean (s.e.m.). In all three graphs, the differences among the means were stastitically significant, as shown above each graph [two-way analysis of variance (anova)]. (c) Other than the acquisition of a biphasic CD19+ expression pattern, the segregation of surface proteins on the co-cultured cells was not significantly different among control, cDC and iDC conditions after 2 days. The data are representative of at least four independent co-cultures of thawed PBMC with cDC, iDC or media control.

