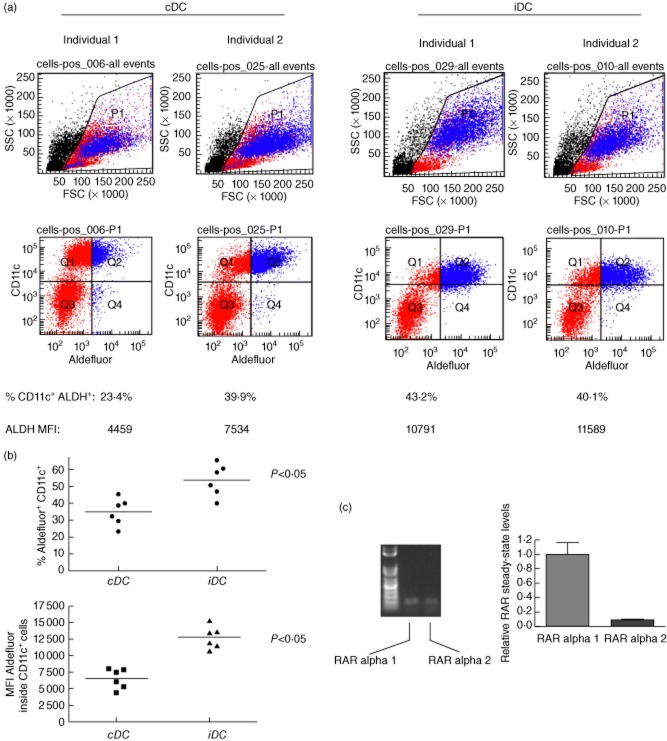
Fig. 3.
Human control dendritic cells (cDC) and immunosuppressive DC (iDC) produce rheumatoid arthritis (RA). (a) cDC and iDC area Aldefluor-reactive. cDC and iDC generated from peripheral blood mononuclear cells (PBMC) from two unrelated healthy adult individuals were stained with Aldefluor and CD11c-specific antibodies. Shown are representative flow cytometric profiles. At the bottom are the values of percentage of CD11c+Aldefluor+ cells and the geometric mean fluorescence intensity (MFI), corresponding to the frequency of CD11c+Aldefluor+ cells at the end of the cDC/iDC generation process and the mean Aldefluor reactivity on a per cell basis, respectively. These data are representative of four independently established cDC/iDC cultures from PBMC of six unrelated, healthy adult individuals. The events coloured red indicate the CD11c+ cells and those coloured blue the Aldefluor-reactive cells. (b) A graphic representation of the frequency of CD11c+Aldefluor+ cDC and iDC generated from PBMC of six unrelated, healthy adult individuals. The data are shown as % Aldefluor+CD11c+ cells of the total cultured cells generated in vitro. The median percentage of CD11c+Aldefluor+ cells between cDC and iDC cultures is statistically significant (P < 0·05) by Mann–Whitney U-test. (c) Steady-state retinoic acid receptors (RAR) alpha 1 and alpha 2 mRNA is readily detectable in flow-sorted human regulatory B cells (Bregs). Total RNA was harvested from 2 × 10⁶ flow-sorted CD19+CD24+CD38+ B cells from freshly collected PBMC of healthy adults, reverse-transcribed and the cDNA was then amplified in semi-quantitative polymerase chain reaction (PCR using RAR isoform-specific primers. Only the alpha 1 and alpha 2 isoforms were amplifiable in cDNA. The gel shows two consistently amplifiable PCR products representing RAR alpha 1 and alpha 2 and the graph on the right shows the relative steady-state mRNA levels of the two detectable transcripts as a fold expression/under-expression compared to the alpha 1 isoform. The bars represent the means of mRNA from cells of triplicate flow sorts and the error bars the standard error of the mean (s.e.m.). The differences in relative expression levels are statistically significant (P < 0·05, Student's t-test).

