
Fig 1.
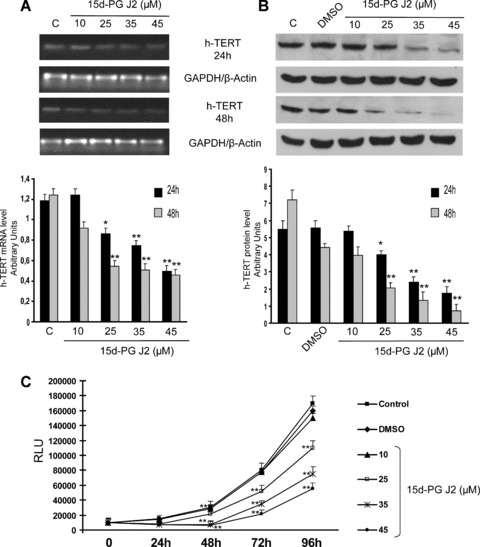
(A) hTERT mRNA levels determined by RT-PCR in CaCo-2 cells treated with different doses of 15d-PG J2 (from 10 to 45 μM) and collected at the indicated times after the treatment. The graphic represents the relative quantification of RT-PCR products performed by densitometric scanning. Data were normalized by using the GAPDH signal and expressed as arbitrary densitometric units. Values represent the means ± S.D. of three independent experiments. Variance analysis: **P < 0.01 versus control. (B) Western blot analysis of hTERT proteins in CaCo-2 cells treated with different doses of 15d-PG J2 (from 10 to 45 μM) and collected at the indicated times after the treatment. Equal protein loading was confirmed by exposure of the membranes to the anti-β-actin antibody. The graphic represents the relative quantification of protein products performed by densitometric scanning. Data were normalized by using the β-actin signal and expressed as arbitrary densitometric units. Values represent the means ± S.D. of three independent experiments. Variance analysis: **P < 0.01 versus control. (C) Growth of CaCo-2 cells treated with 15d-PG J2 at the indicated concentrations (from 10 to 45 μM), collected at the indicated times. Cell proliferation was detected by measuring the luminescence released by the metabolically active cells. The values, expressed in RLUs are the means ± S.D. of three separate experiments. Variance analysis: *P < 0.05, **P < 0.01 versus control.