
Fig 3.
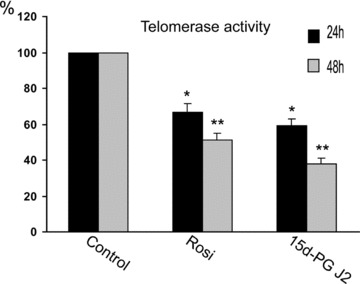
Telomerase activity. The activity was evaluated at the indicated times in CaCo-2 cells after treatment with PPARγ ligands (200 μM Rosiglitazone, Rosi, and 25 μM 15d-PG J2). The activity was expressed as ng of DNA produced/μg of protein and reported as the percentage of control (C) values.