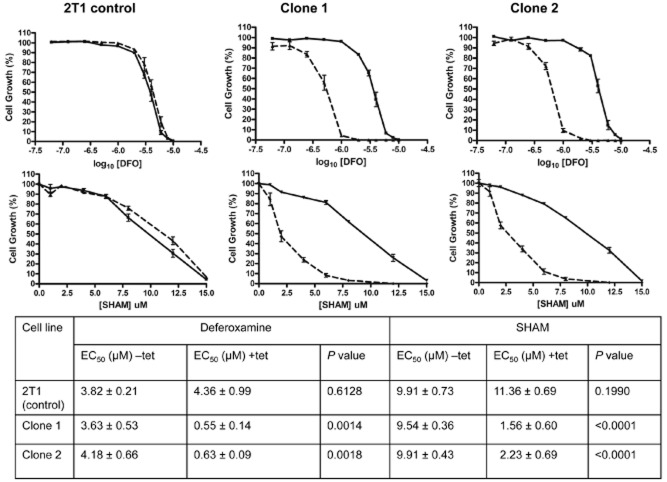
Figure 4.
TbMLP downregulation leads to enhanced susceptibility to iron chelators. Cells were induced for 24 h and then plated in varying concentrations of deferoxamine (DFO) or SHAM. Plates were incubated for 72 h and growth measured using alamarBlue™. The baseline was calculated using alamarBlue™ incubated with medium alone. Control cells (2T1 strain) are shown in the left hand panels and two independent RNAi clones in the centre and right hand panels. Solid line indicates cells incubated without tetracycline (−tet) and broken line indicates cells induced with tetracycline (+tet). EC50 values (±SEM) are illustrated in the table. EC50 values were determined using Graphpad PRISM software and the significance of the difference between EC50 values (+/−tet) was calculated using the F-test (P-values shown in table).

