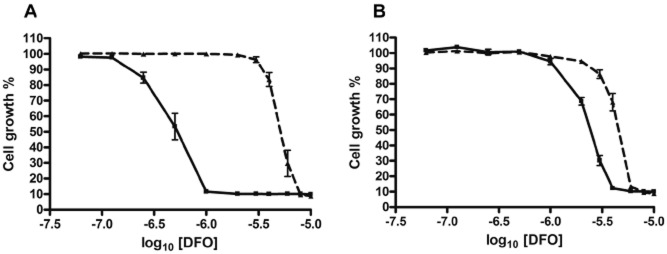
Figure 6.

Conditional null mutants also display enhanced susceptibility to deferoxamine (DFO). Cells were repressed for 24 h and then plated in varying concentrations of deferoxamine. Control cells were maintained in tetracycline (1 μg ml−1). Plates were incubated for 72 h and growth measured using alamarBlue™ as in Fig. 4. The broken black lines represent growth in the presence of tetracycline. The solid black lines represent growth in the absence of tetracycline.A. DKO1 (EC50 +tet 5.11 ± 0.57 μM, −tet 0.48 ± 0.11 μM; P < 0.0002).B. DKO2. (EC50 +tet 4.35 ± 0.27 μM, −tet 2.28 ± 0.27 μM; P < 0.0016).EC50 values were calculated using Graphpad PRISM software and the significance of the difference between EC50 values (+/−tet for each clone) was calculated using the F-test.
