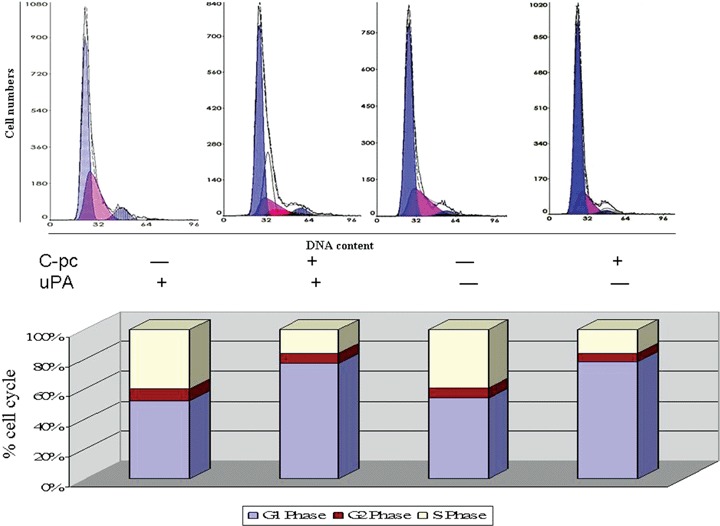
Fig. 3.

Cell cycle analysis. Different phases of cell cycle were analysed by flow cytometry. Treatment with 75 μg/ml C-pc increased the number of cells in the G1 phase. C-pc increased the G1 phase of cell cycle in uPA-independent manner. Values of different cell cycle stage are adjusted to 100%. Results are mean ± S.D. of three independent experiments.
