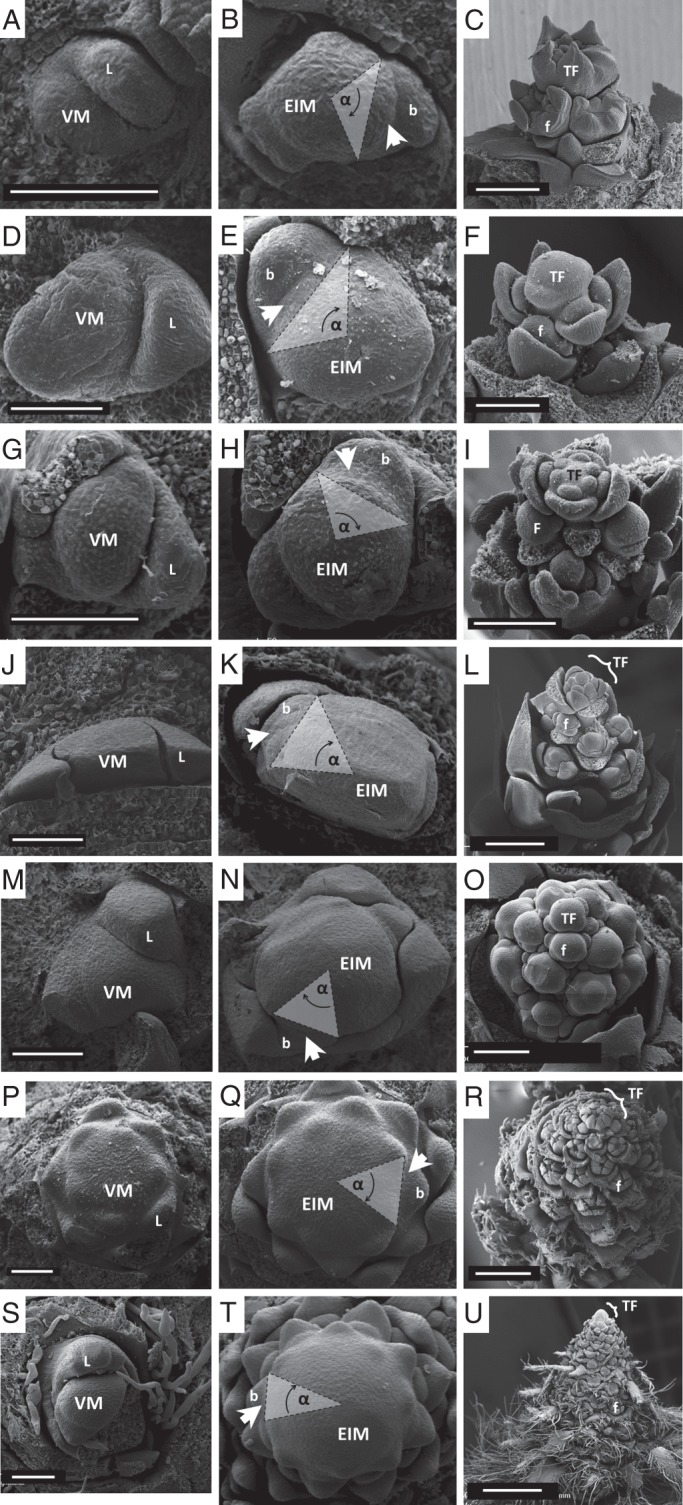
Fig. 2.

SEM images depicting ontogeny of closed inflorescences. Each row contains images of one species and each column represents one ontogenetic state: first column, vegetative meristem (VM); second column, early inflorescence meristem (EIM; same scale as in first column); third column, the complete inflorescence formed. Species are ordered according to the number of nodes in the mature inflorescence from small (top) to large (bottom) – smaller inflorescences present relatively smaller EIMs (higher α values; where α = insertion angle of the youngest primordium) and larger inflorescences show larger EIMs (smaller α values). Arrowheads denote the youngest lateral primordium. (A–C) Neviusia alabamensis (Rosaceae: 5·1 ± 0·7 nodes); (D–F) Dicentra eximia (Papaveraceae; 5·1 ± 0·6 nodes); (G–I) Capnoides sempervirens (Papaveraceae; 5·5 ± 0·6 nodes); (J–L) Mahoberberis × aquisargentii (Berberidaceae; 12·2 ± 2·0 nodes); (M–O) Berberis aristata (Berberidaceae; 16·2 ± 1·8 nodes); (P–R) Campanula thyrsoides (Campanulaceae; 94·3 ± 25·8 nodes); (S–U) Agrimonia eupatoria (Rosaceae; 105·0 ± 25·7 nodes). Abbreviations: L, leaf primordium; b, subtending bract; f, lateral young flowers; TF, terminal flower. Scale bars: first two columns = 100 µm; (C, F, I, O) = 200 µm; (L) = 500 µm; (R, U) = 1 mm.
