Fig 5.

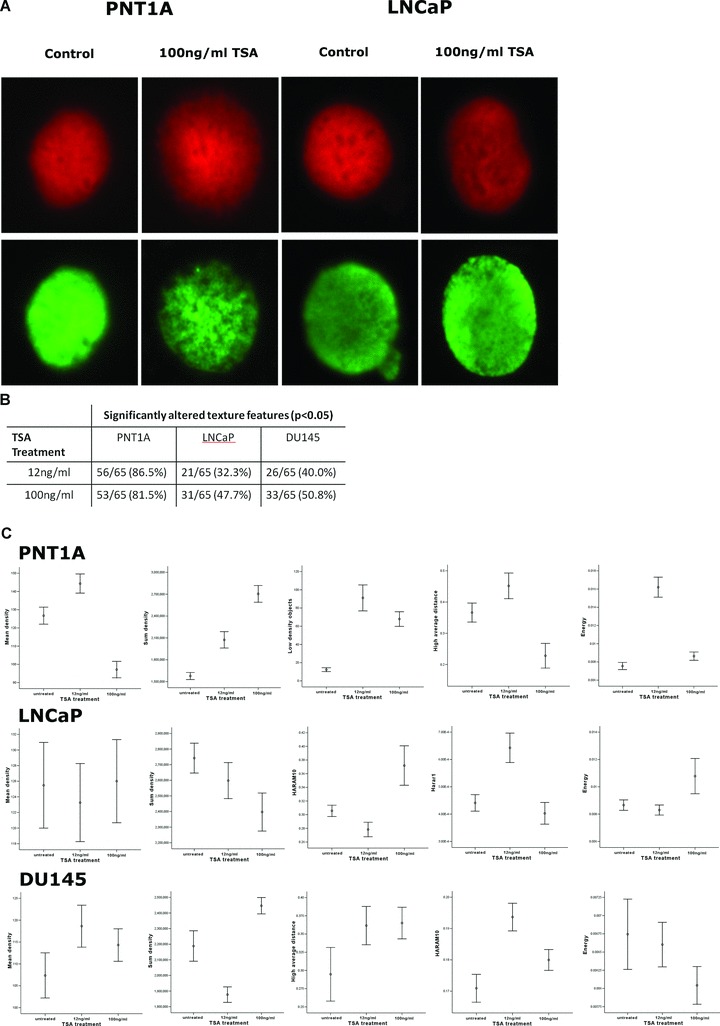
Fig. 5 TSA-induced chromatin changes in G1 enriched cell populations, as measured by quantitative digital texture analysis (A) Images show DNA distribution in red (PI) and AcH3K9 in green (FITC conjugated antibody) in G0/G1 sorted populations of PNT1A, LNCaP and DU145 cells treated with TSA (Leica CTR6000, ×63 objective magnification). (B) Quantitative Fluorescence texture analysis was performed on these images and texture feature measurements were based on transmission pixel values. A table representing the total number of chromatin texture features altered in each cell line following low and high doses of TSA showed the most significant impact of TSA on chromatin phenotype in PNT1A cells. (C) To summarize the chromatin results, graphs were plotted (summarized using the mean and 95% confidence intervals) for a subset of significantly altered chromatin texture features within each cell line in response to TSA treatment in G0/G1 sorted cells. The texture features plotted here represent changes in both density and distribution of chromatin. Although distributional features such as energyare significantly disrupted in all cell lines, the graphs representing mean densityindicate a global chromatin decondensation in PNT1A cells but not in LNCaP and DU145 cells.
