
Fig 6.
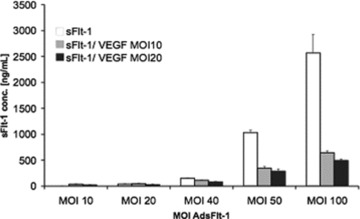
ELISA quantification of in vitro complex formation between sFlt-1-Fc and VEGF in cell supernatants. Five hundred fifty-nine cells were infected with increasing amounts of Ad-sFlt-1in the absence (white bars) or in the presence of Ad-VEGF with a MOI of 10 (grey bars) or with MOI of 20 (black bars). The amounts of sFlt-1 in the supernatant 72 hrs after infection were diluted and measured by an ELISA for mouse Flt-1. Indicated are the mean values from duplicates (mean ± SEM).