
FIGURE 6.
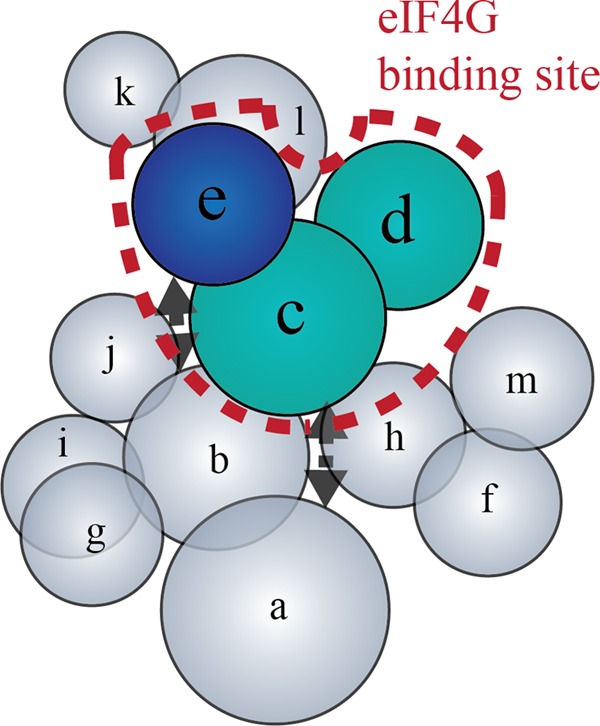
Model of eIF4G interaction sites on eIF3. The human eIF3 subunit interaction map is adapted from Zhou et al. (19). Placement of each subunit and the dotted black arrows reflect known intra-complex interactions between subunits. The dashed line encloses subunits involved in eIF4G binding. eIF3 subunits are colored according to the color schemes used in Figs. 4 and 5, which is based on the subdomain of eIF4G that each eIF3 subunit contacts.