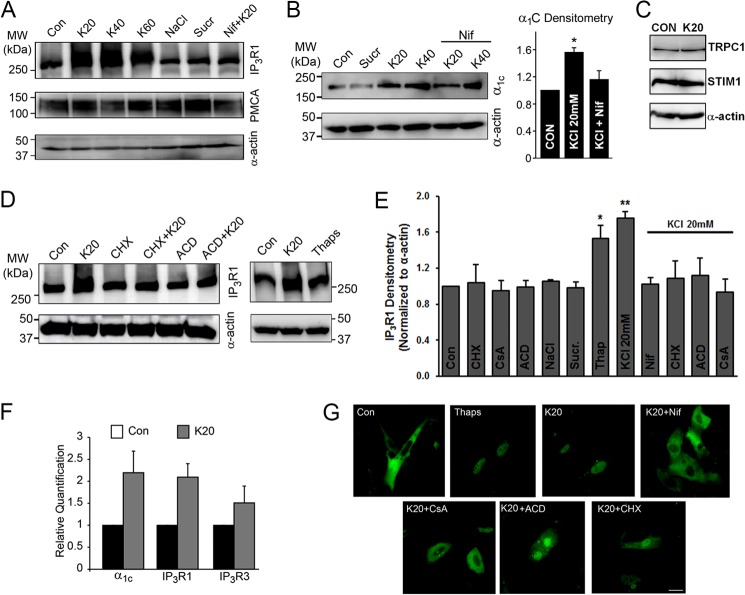
FIGURE 3.
Depolarization of A7r5 cells for 24 h replicates the induction of IP3R and α1C observed in VSM cells of hypertensive animals in vivo. A–E, immunoblot analyses of IP3R, PMCA, and α1C. Proteins were isolated from A7r5 cells and separated on SDS-PAGE, and the blots were probed for the appropriate antigens as indicated. A, IP3R1 expression is increased in A7r5 cells exposed to K20, K40, or K60 for 24 h but not in cells treated with NaCl or sucrose (Sucr) as osmolar controls. Depolarization-induced IP3R up-regulation is lost in the presence of the LTCC blocker, Nif (10 μm). Expression levels of PMCA are unchanged. B, the expression level of α1C is significantly increased in A7r5 cells incubated with K20 or K40 for 24 h but not in cells exposed to sucrose or 10 μm Nif (n = 3). C, expression levels of TRPC1, STIM1, and α-actin are not altered in A7r5 cells depolarized for 24 h by 20K. D, right blot shows that IP3R1 up-regulates in A7r5 cells exposed to 20K or treated with Thaps (1 μm) for 24 h. The up-regulation of IP3R1 by K20 is blocked by 10 μg/ml CHX or 10 μm ACD. Blots are representative of at least three independent experiments. Smooth muscle-specific α-actin was used as a loading control. E, relative immunodensity of the IP3R1 after normalization to α-actin. Cell depolarization with K20 or treatment with Thaps (1 μm) for 24 h increases IP3R1 expression, and this response is lost in the presence Nif (10 μm), CHX (10 μg/ml), ACD (10 μm), or CsA (10 μm) (n = 3–21; *, p < 0.05; **, p < 0.01). F, transcriptional up-regulation of IP3R1, IP3R3, and α1C in A7r5 cells depolarized by K20 for 24 h. Real-time PCR plots represent relative quantification. G, nuclear translocation of NFATc1 in A7r5 cells. Cells were transfected with plasmids expressing EGFP-NFATc1 and imaged using a confocal laser-scanning microscopy. At rest (Con), NFATc1 showed a basal cytoplasmic localization, but treatment with Thaps (1 μm) or K20 alone or in the presence of CHX (10 μg/ml), ACD (10 μm), or CsA (10 μm) promotes its nuclear translocation. In contrast, incubation of cells with 10 μm Nif or CsA prevents K20-induced nuclear translocation of NFATc1. Data are representative of four independent experiments. Scale bar, 20 μm. Error bars, S.E.

