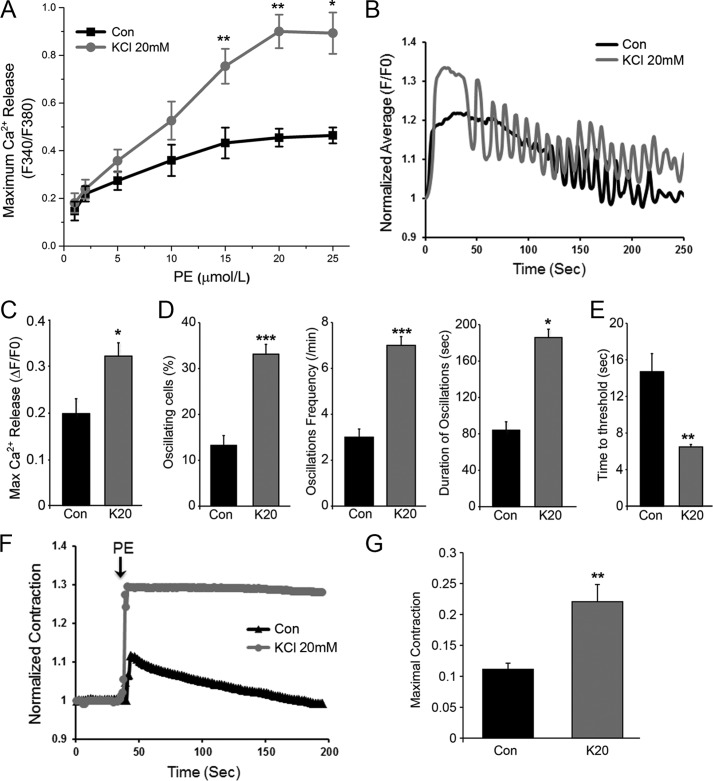
FIGURE 5.
IP3R up-regulation sensitizes IP3-dependent Ca2+ release and VSM contraction. A, PE concentration-response curve for Ca2+ release in control (Con) A7r5 cells or similar cells depolarized by K20 for 24 h to up-regulate IP3R. Cells were loaded with Fura2-AM and bathed in Ca2+-containing HBS, and images were acquired using an epifluorescence microscope. At low PE concentrations, the two groups of cells had similar fluorescence amplitudes. At PE concentrations above 5 μm, K20-pretreated cells showed higher fluorescence amplitude than control. Values are the mean of fluorescence intensity of 15–20 individual cells for each group given as the relative change in Fura2 fluorescence ratio (ΔF340/F380) (n = 3–5, mean ± S.E.; *, p < 0.05; **, p < 0.01). B–E, kinetics of IP3-dependent Ca2+ release evoked by UV photorelease of ciIP3 in A7r5 cells bathed in Ca2+-containing HBS and loaded with ciIP3 and Ca-Green-1. ciIP3 was uncaged by repeated exposure of cells to UV illumination (100 ms every 1.5 s), and the fluorescence of Ca-Green was recorded in real time. B, in a subset of cells, ciIP3 uncaging caused an initial global sustained Ca2+ transient followed by Ca2+ oscillations in both control and 20K-pretreated cells. Cells in both groups also responded to ciIP3 uncaging by a monotonic Ca2+ rise without Ca2+ oscillations. C, the maximal IP3-dependent Ca2+ release was increased in K20-pretreated cells exhibiting enriched IP3R (n = 8; *, p < 0.05). D, the percentage of oscillating cells (n = 8–10; ***, p < 0.0001), oscillation frequency/min (n = 5–8; ***, p < 0.0001), and duration of oscillations (n = 5–7; *, p = 0.05) were enhanced in K20-pretreated cells. E, the time to threshold Ca2+ signal was shortened in K20-pretreated cells compared with control (n = 8; **, p < 0.001). F, contractile responses of A7r5 cells to PE (20 μm) in Ca2+-containing HBS were evaluated by imaging of contractile fiber formation. PE results in a transient contractile response in control cells, whereas the contractile response in 20K-pretreated cells is more pronounced and sustained. G, statistical analysis of the maximal contractile response to PE of control and K20-pretreated A7r5 cells (n = 4; **, p < 0.05). Error bars, S.E.

