
FIGURE 2.
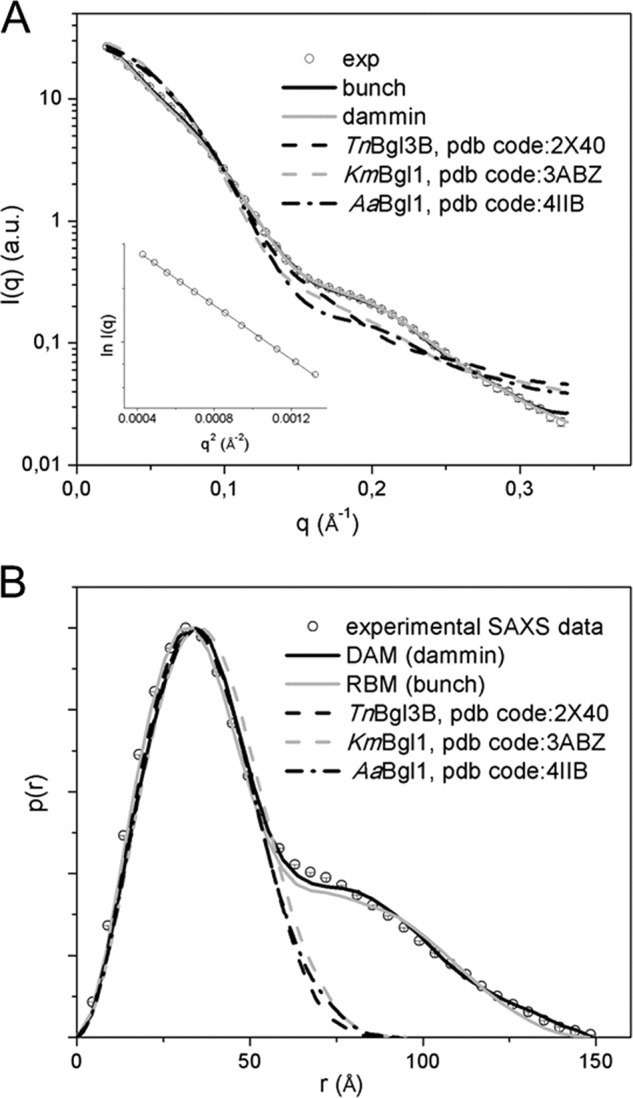
A, small angle x-ray scattering curves, real and reciprocal spaces. Merged experimental SAXS curve (sphere), simulated curves from rigid body model (black line), dummy atom model (gray line), TnBgl3B, PDB code 2X40 (black dashed line), KmBgI1, PDB code 3ABZ (dashed gray line) and AaBgI1, and PDB code 4IIB (black dashed/dotted line) are shown. Inset contains Guinier analysis lnI(q) versus q2. B, distance distribution function p(r), the same symbols were used.