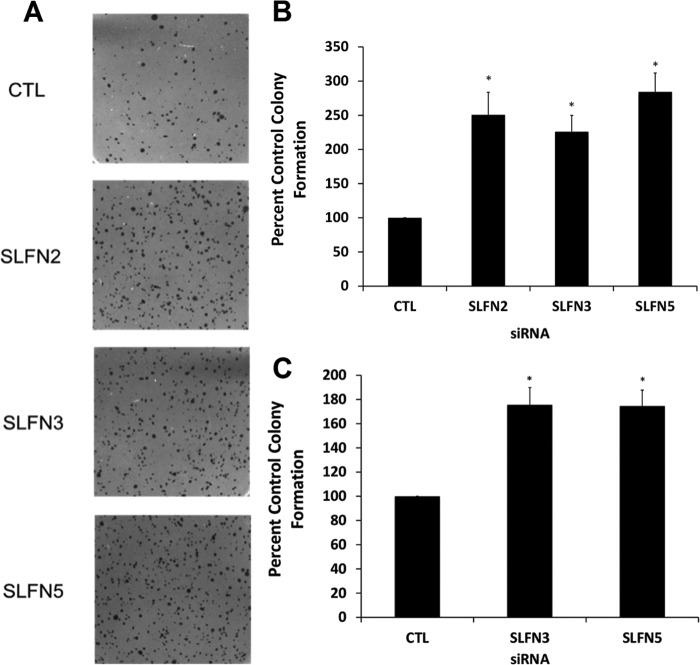
FIGURE 8.
Effects of knockdown of Slfn2, Slfn3, and Slfn5 on anchorage-independent RCC cell growth. A, RENCA cells were transfected with control siRNA or Slfn2, Slfn3, or Slfn5 siRNAs. Equal number of cells were plated in soft agar and allowed to form colonies for 14 days. Representative images of the soft agar wells are shown. B, quantitation of colonies from four independent experiments, including the one shown in A. Data are expressed as % control siRNA-transfected cells and represent means ± S.E. of four experiments. *, p < 0.05. C, CD3575 cells were transfected with control siRNA or Slfn3 or Slfn5 siRNAs. Equal number of cells were plated in soft agar and colonies were quantified after 14 days. Data are expressed as % control (CTL) siRNA-transfected cells and represent means ± S.E. of four experiments.

