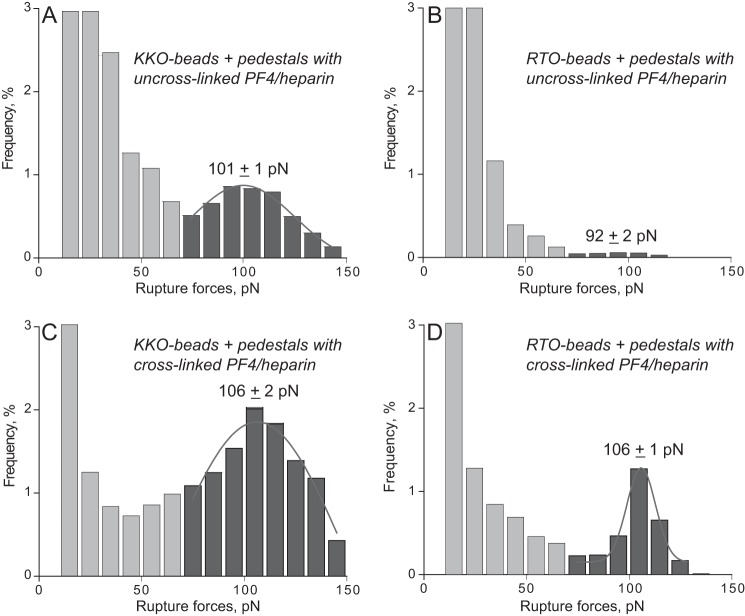
FIGURE 7.
Interactions of KKO (A and C) and RTO (B and D) with WT PF4-heparin complexes before (A and B) and after (C and D) treatment with 0.5% glutaraldehyde. The data are displayed as normalized rupture force distributions with two force regimes. The higher force peak is fitted with a Gaussian function. The total number of contacts (n = 19,421 for A, n = 23,934 for B, n = 23,364 for C, and n = 25,326 for D) is taken to be 100%.

