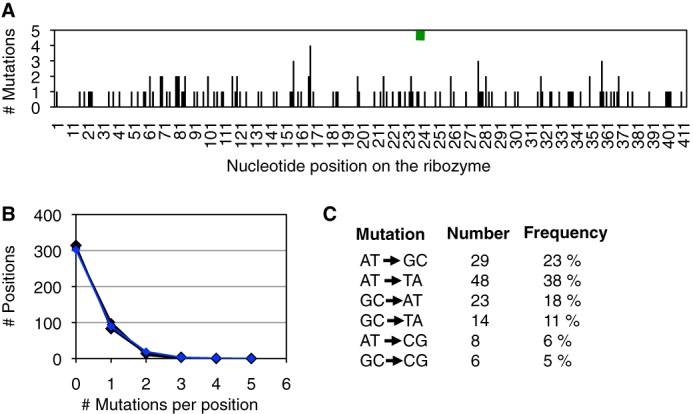
FIGURE 4.

PCR analysis of mutations generated. A, distribution of 128 mutations generated by mutagenic PCR (blue) over the 414 nucleotide positions of the Tetrahymena ribozyme. The green rectangle shows the position of the P6b stem-loop mutations (positions 236–241). B, frequency of multiple mutation occurrences at the same position. Of the 414 positions, the number of positions is shown with 0, 1, 2, 3, and 4 mutations (blue). Five data sets with a random distribution are shown as comparison (black). C, mutational bias in the type of mutations. For each of the six types of mutations, their number of occurrences (total = 128) and their relative frequencies are shown. One insertion and 12 deletions were also detected (data not included).
