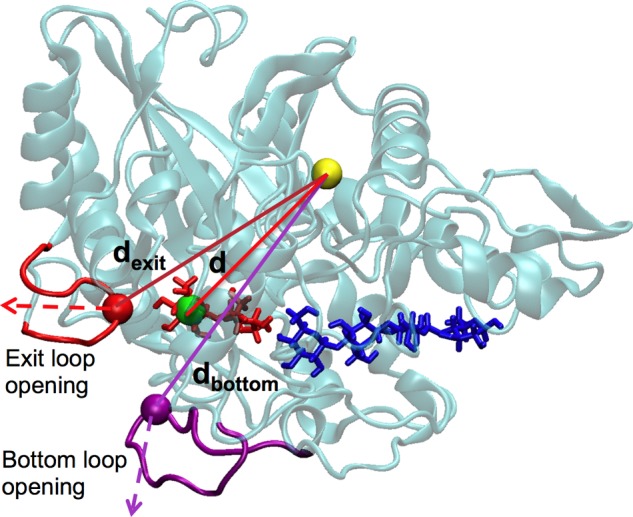
FIGURE 4.

SMD simulation setup for TfuCel6B. Two dummy atoms, representing the endpoints of the pulling distance d, are shown as a green sphere (representing the center-of-mass of glucose at the −2 site in TfuCel6B), as well as a yellow sphere (representing the center-of-mass of 79 Cα atoms from TfuCel6B residues 318:324, 333:348, 358:363, 398:418, 420:426, 478:488, and 543:553). These residues were chosen to represent the position of the enzyme because they form stable secondary structures and have small RMSF values (see data below). The green and yellow dummy atoms align between the exit loop opening pathway and the bottom loop opening pathway to avoid any bias. Two additional dummy atoms, representing the positions of the tip of the exit loop and the bottom loop, are shown as a red sphere (representing the exit loop), as well as a purple sphere (representing the bottom loop). The distances dexit and dbottom are used to determine the amplitude of loop opening.
