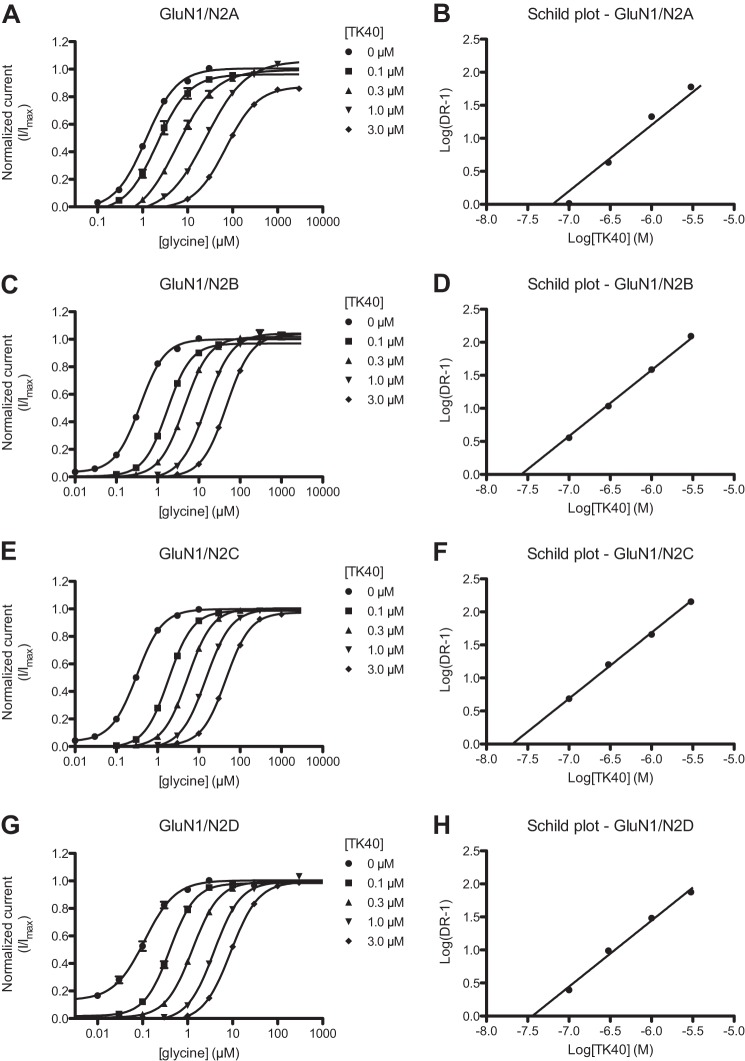
FIGURE 2.
Schild analysis; TK40 reduces potency of glycine at the GluN1 subunit. A, C, E, and G, glycine concentration-response curves at the four recombinant GluN1/N2 receptors co-activated by 100 μm glutamate in the absence (0 μm) or presence of increasing concentrations of TK40. Data are from 6–8 oocytes. B, D, F, and H, Schild plots of glycine concentration-response data at the four recombinant GluN1/N2 receptors. DR, dose ratio (DR = EC50′/EC50) calculated from the EC50 values of glycine in the absence (EC50) and presence (EC50′) of TK40. Because the Schild slope was not significantly different from 1, the slope is constrained to 1 according to the Schild equation. The Kb values of TK40 are listed in Table 2.

