
FIGURE 3.
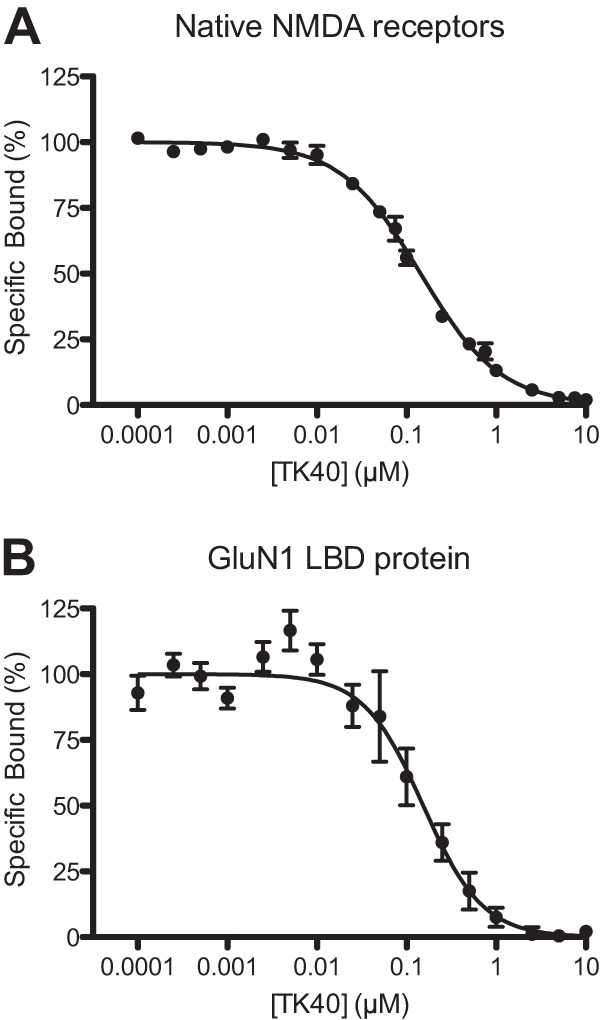
Radioligand binding competition data. Radioligand binding competition curves of TK40 at native NMDA receptors in rat cortical synaptosomes using [3H]L-689,560 as the radioligand (A) or at GluN1 LBD protein using [3H]MDL-105,519 as the radioligand (B). Shown are mean ± S.E. of pooled data from 4–6 separate experiments, conducted in triplicate. A, IC50 = 143 nm, nH = 0.97; B, IC50 = 153 nm, nH = 1.31.