
FIGURE 5.
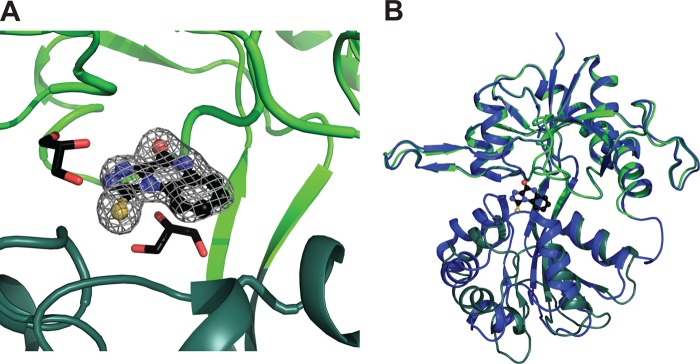
Crystal structure of the antagonist TK40 in the ligand-binding domain of GluN1. A, the omit FO − FC electron density map contoured at the 3σ level. TK40 is shown in a black ball-and-stick representation, D1 in light green, and D2 in dark green (molA). Two glycerol molecules in 4-Å vicinity of TK40 are shown, forming van der Waals interactions to TK40. B, TK40 induces ∼23° domain opening in the LBD of GluN1 compared with the structure of GluN1 in complex with glycine (PDB code 1PB7; molA; blue). The structures were superimposed on D1 residues, and the D1-D2 domain opening was calculated using DynDom (37).