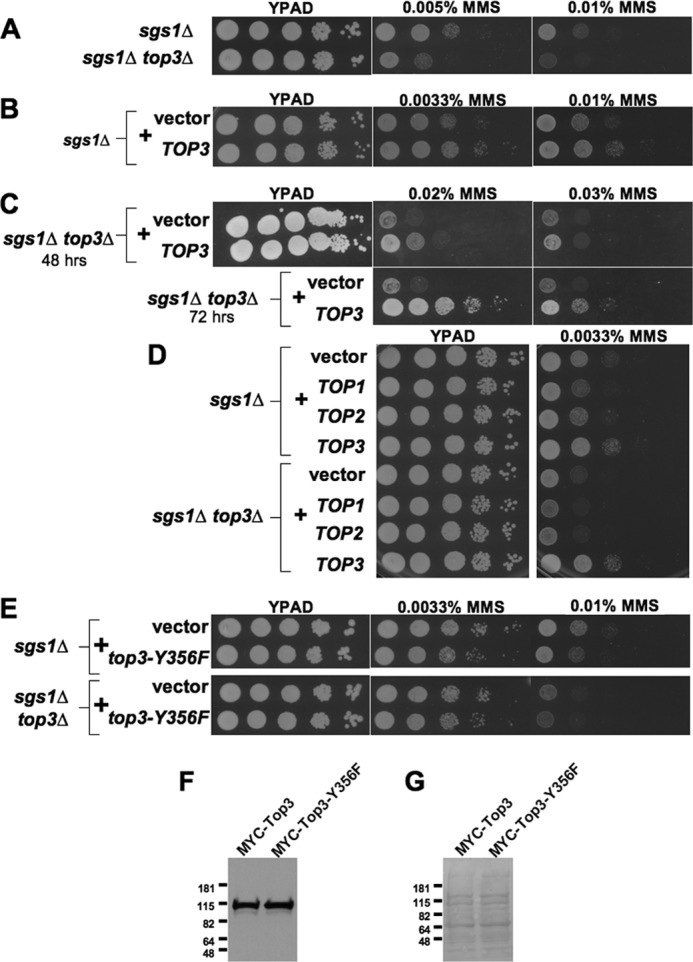
FIGURE 2.

Top3 provides DNA damage resistance in sgs1Δ mutants. Spot assays comparing the effects of MMS on the growth of: A, sgs1Δ and sgs1Δ top3Δ mutants; B, sgs1Δ mutants without or with a TOP3 overexpression plasmid; C, sgs1Δ top3Δ mutants without or with a TOP3 overexpression plasmid showing resistance at higher levels of MMS; D, sgs1Δ and sgs1Δ top3Δ mutants with control vector or plasmids overexpressing TOP1, TOP2, or TOP3; and E, sgs1Δ or sgs1Δ top3Δ cells with control vector or plasmid expressing the catalytically inactive top3-Y356F allele. 10-Fold dilutions of strains were spotted onto YPAD alone or containing the indicated concentrations of MMS and grown as indicated for 48 (and for C up to 72) h. F, Western blot from log-phase sgs1Δ top3Δ cells containing plasmids expressing TOP3 promoter-driven MYC-TOP3 or MYC-top3-Y356F and probed with an anti-Myc tag antibody. G, Ponceau S staining of the same membrane as in F to confirm equal loading of protein. Molecular mass markers are indicated (kDa).
