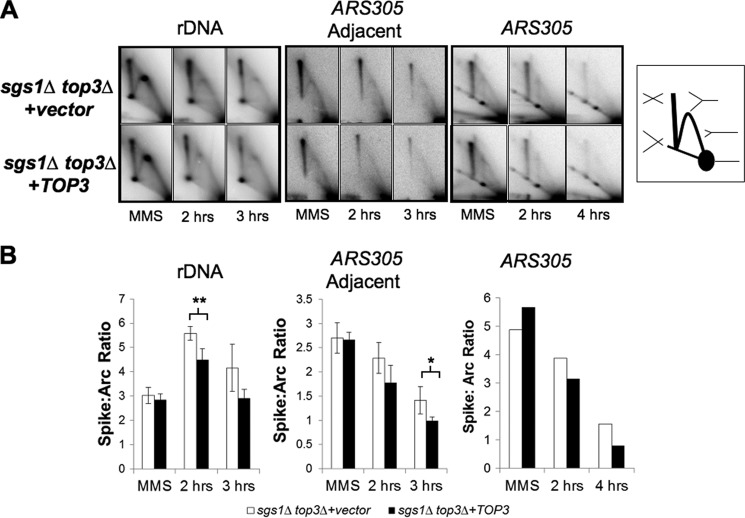
FIGURE 5.
Top3 overexpression reduces the level of X-shaped molecules within sgs1Δ top3Δ cells. A, representative two-dimensional gel electrophoresis Southern blots examining replication intermediates that accumulate in sgs1Δ top3Δ cells containing either vector or TOP3 overexpression plasmid during exposure to MMS and following release into MMS-free medium. An rDNA fragment containing the replication fork block, a fragment adjacent to an ARS305-containing fragment, as well as the ARS305-containing fragment, are shown on the left, middle, and right sets of panels, respectively. MMS indicates cells grown for 1.5 h in 0.033% MMS, and 2 h, 3 h, and 4 h indicate cells 2, 3, and 4 h after release from MMS. Right, schematic showing the location of DNA structures visualized by two-dimensional gel electrophoresis, including the 1 n spot containing non-replicating duplex, the Y-arc containing single replication forks, and the X-spike containing two duplexes interlinked at different positions along their lengths. B, quantification of the ratio of X-shaped molecules to those running within the replication arc (n = 3 biological replicates for the rDNA fragment and ARS305 adjacent fragment, and error bars represent the S.E.; *, p = 0.034; **, p = 0.009).

