
FIGURE 1.
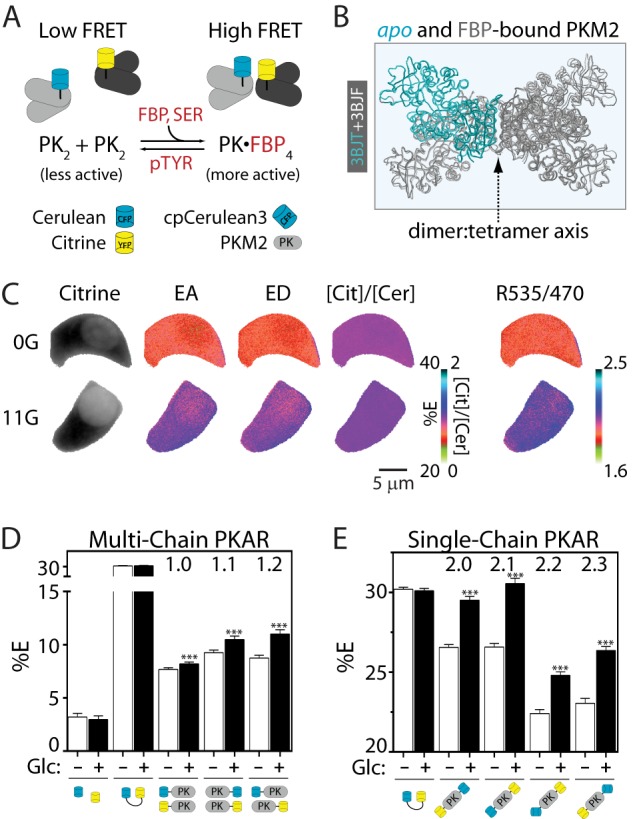
PKARs exhibit glucose-dependent changes in FRET. A, simplified schematic of PKAR activation by FBP and serine (SER) and inactivation by tyrosine phosphorylation and phosphotyrosine peptide binding (pTYR). Note that although the ideal case is pictured, tetrameric complexes formed by the association of PK dimers (PK2) are likely to contain more than one FRET donor or acceptor; FRET efficiencies, therefore, reflect the average of all possible probe combinations. B, overlay of the apo (light gray with one aqua PKM2 monomer) and FBP-bound (dark gray) PKM2 crystal structures showing the dimer:tetramer axis. C, Min6 cells expressing PKAR2.1 were glucose-starved (0G) or treated with 11 mm glucose (11G) to illustrate probe localization and calculation of FRET efficiencies by “stoichiometry” (EA, FRET efficiency of acceptor in complex; ED, FRET efficiency of donor in complex; [Cit]/[Cer], the mole fraction of acceptor to donor) and by the FRET/Cerulean emission ratio (R535/470). D and E, average PKAR FRET efficiency (%E) in Min6 cells ±25 mm glucose (Glc) for multi-chain (D) or single-chain (E) PKAR. %E = (EA+ED)/2; for the single-chain biosensors, EA = ED. Error bars represent the mean ± S.E., n ≥ 20 cells per treatment from ≥6 independent experiments. Analysis of variance with Bonferroni post-test: **, p < 0.01; ***, p < 0.0001.