
FIGURE 5.
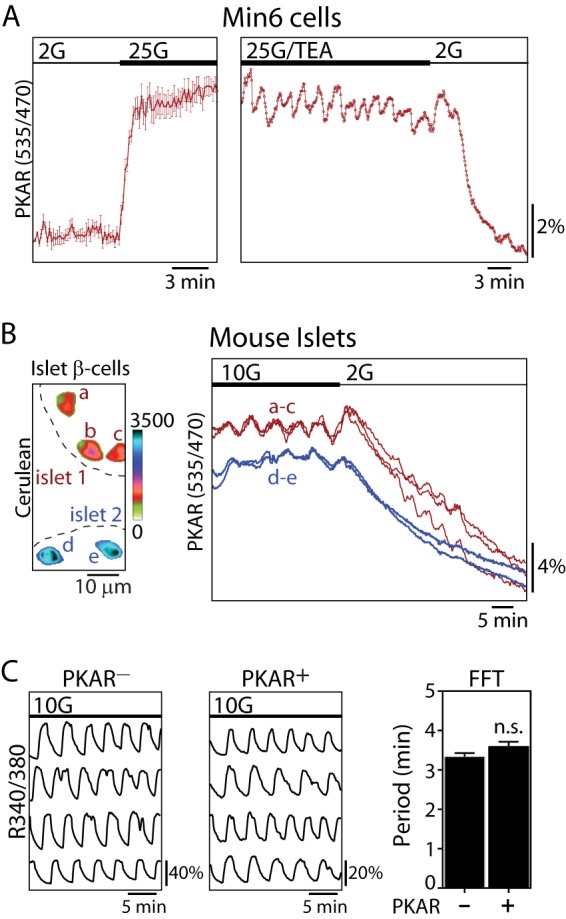
PKM2 activity is oscillatory in Min6 cells and mouse islet β-cells. A, time-resolved change in PKAR FRET (mean ± S.E., n = 8) in response to glucose elevation (2–25 mm) in Min6 cells; traces were normalized to the initial FRET/Cerulean ratio (left). A representative trace shows oscillations in PKAR FRET induced by 25 mm glucose and 10 mm tetraethylammonium (25G/TEA) (right). Sampling interval = 10 s. B, time-lapse imaging of PKAR2.3, expressed in β-cells under control of the rat insulin promoter in two mouse islets perfused with 10 and 2 mm glucose. Cerulean images (left) show the location of β-cells expressing PKAR2.3; the color bar reflects Cerulean fluorescence intensity. C, representative traces showing intracellular Ca2+ oscillations naïve islets (n = 25) or islets treated with adenovirus carrying PKAR (n = 29) as indicated. The average oscillatory period (mean ± S.E.) was quantified by fast Fourier transform (FFT) from >20 min of recording. No significant difference in period were found by an unpaired t test. n.s., not significant.