
FIGURE 6.
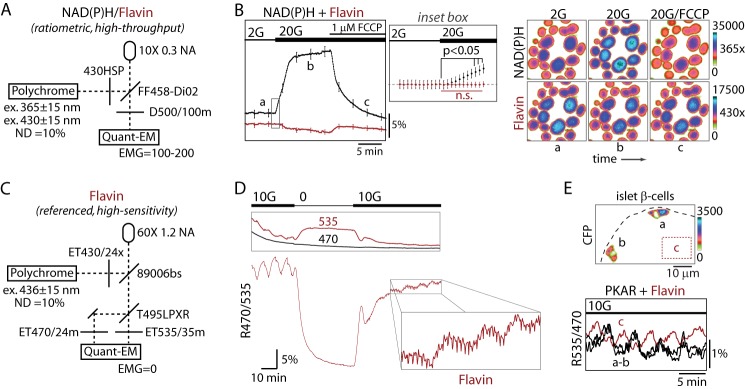
PKM2 activity is in phase with mitochondrial redox potential. A, line diagram of the microscope configuration for simultaneous NAD(P)H and flavin imaging (also known as the redox ratio) excited at 365 nm and 430 nm, respectively. ND, neutral density filter; NA, numerical aperture; EMG, electron multiplication gain. B, glucose-dependent changes in islet NAD(P)H and flavin fluorescence (F/F0) are shown in response to the mitochondrial uncoupled FCCP (1 μm). Traces reflect the mean ± S.E., n = 68 islets from 2 mice. The inset box is expanded (middle panel) to show NAD(P)H (black) and flavin (red) fluorescence immediately after glucose elevation. Images were taken every 5 s. The image series (right) shows a representative field of islets during the recording at times a, b, and c. n.s., not significant. C, line diagram of the microscope configuration for high sensitivity flavin imaging at 436-nm excitation, which exactly matches the optical configuration for the FRET/Cerulean emission ratio (R535/470). D, flavin imaging of a naïve islet at the indicated glucose concentrations using the imaging parameters in C. The individual emission channels (535 nm, flavin fluorescence; 470, reference) are shown in the box (top), and the emission ratio R470/535 (below) is proportional to the level of reduced flavins and redox potential. Data are representative of 24 recordings from five mice. E, simultaneous recording of PKAR FRET (cells a and b) and flavin fluorescence (untransduced cells in region, c) in neighboring cells of an islet stimulated with 10 mm glucose (10G); note that R535/470 is used for both measurements. Traces are representative of eight independent experiments from three mice.