FIGURE 2.
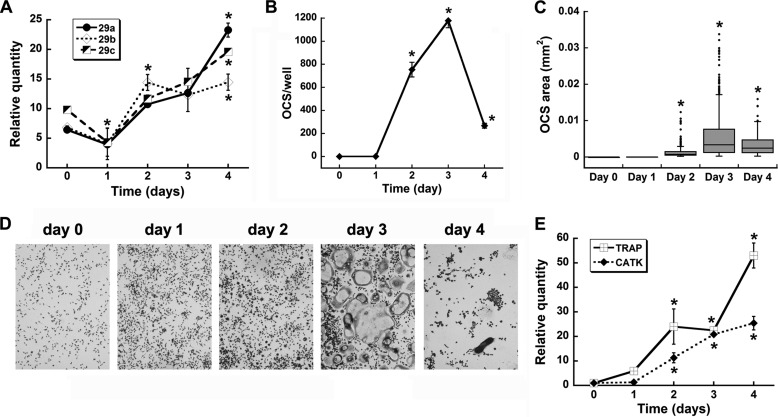
miR-29 expression in RAW264.7 cells recapitulates the pattern observed in primary osteoclast precursor cells. A, the expression of miR-29a, -b, and -c was analyzed over 4 days of differentiation with RANKL (30 ng/ml). B, number of osteoclasts per well (n = 3, 96-well plate). C, osteoclast area. Box plot lines represent the 25% quartile of the data, the median, and the 75% quartile. Outliers are denoted by dots (n = 3 wells, 96-well plate). D, representative images of TRAP stained cultures at days 0, 1, 2, 3, and 4 of differentiation, respectively, were captured using 10× magnification. E, gene expression levels for osteoclast markers. *, significantly different from day 0, p < 0.05. OCS, osteoclasts; CATK, cathepsin K.

