FIGURE 2.
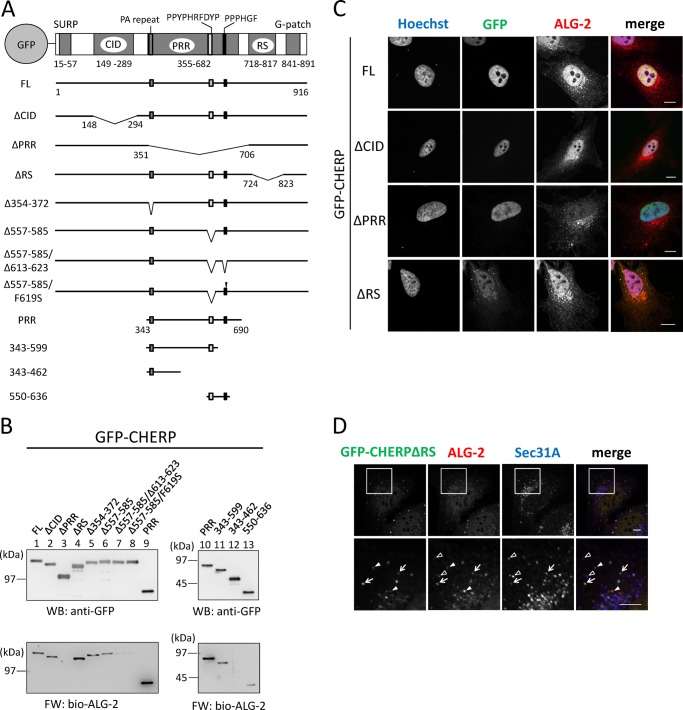
Identification of ALG-2-binding sites and subcellular localization of GFP-CHERP mutants. A, schematic diagrams of GFP-fused CHERP and its deletion mutants. CHERP has five distinct regions containing sequences similar to those designated SURP, CID (RNA polymerase II C-terminal domain-interacting domain), PRR (Pro-rich region), RS (Arg/Ser-rich region), and G-patch. Approximate positions of three motifs (PA repeat, PPYPHRFDYP, and PPPHGF) are indicated at the top bar and marked with small filled boxes in black and gray in each expression construct. Filled arrowhead indicates replacement of Phe619 with Ser (F619S mutation). B, FW blot analysis of GFP-fused CHERP and its deletion mutants with biotin-labeled ALG-2. HEK293T cells expressing GFP-fused CHERP FL and mutant proteins were lysed and centrifuged at 10,000 × g for 10 min. GFP fusion proteins were immunoprecipitated with GFP-TrapA from the cleared cell lysates and subjected to FW blot analysis with biotin-labeled ALG-2 (bio-ALG-2) and WB analysis using anti-GFP mAb. C, HeLa cells expressing GFP-fused CHERP FL and deletion mutants were fixed in 4% paraformaldehyde in PBS and permeabilized with 0.1% Triton X-100. Then the cells were immunostained with anti-ALG-2 pAb. Nuclear DNA was stained with Hoechst 33342. Fluorescence signals in the merged images are represented in pseudocolors as follows: Hoechst, blue; GFP, green; ALG-2, red. Bars, 10 μm. D, HeLa cells expressing GFP-CHERP ΔRS were fixed in 4% paraformaldehyde in PBS and permeabilized with 0.1% Triton X-100. Then the cells were double-immunostained with anti-ALG-2 pAb (red) and anti-Sec31A mAb (blue). Bars, 5 μm. Lower panels are magnified images of upper panels. Arrows, Puncta of GFP-CHERP ΔRS are co-localized with those of ALG-2 and Sec31A. Solid arrowheads, puncta of GFP-CHERP ΔRS are co-localized only with those of ALG-2. Unfilled arrowheads, puncta of ALG-2 are co-localized only with those of Sec31A. Representative data obtained from at least two independent experiments are shown for B–D.

