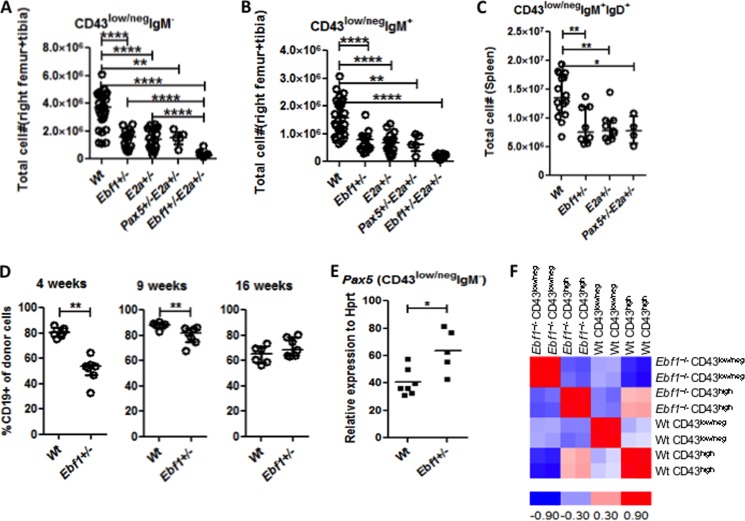
FIGURE 4.
Loss of one allele of Ebf1 results in impaired development of B-lymphoid cells. Diagrams display the absolute numbers of 7-AAD− pre-B-cells (Lin−B220+CD19+CD43low/negIgM−) (A) or IgM+ cells (Lin−B220+CD19+CD43low/negIgM+) (B) in BM from Wt, Ebf1+/−, E2a+/−, Pax5+/−E2a+/−, or Ebf1+/−E2a+/− mice and Lin−B220+CD19+CD43low/intIgM+IgD+ spleen cells (C) from Wt, Pax5+/−, Ebf1+/−, or E2a+/− mice. D, diagrams displaying the percentage of CD19+ cells among the total number of CD45.2+ cells in the peripheral blood of mice transplanted with either Wt or Ebf1+/− fetal liver after 4, 9, and 16 weeks, as indicated. Each dot in the panel represents one mouse, and the average values are indicated by horizontal lines. Statistical analysis was performed using the Mann-Whitney U test. E, diagram displaying quantitative RT-PCR data to investigate PAX5 expression in sorted pre-B (Lin−B220+CD19+CD43low/negIgM−) cells from Wt or Ebf1+/− mice. The data were normalized to the expression of Hprt and collected from seven individually sorted Wt and 5 Ebf1+/− mice analyzed in triplicate quantitative RT-PCRs. Each dot in the panel represents one mouse, and the data are presented as median (horizontal line) ± interquartile range. Statistical analysis was performed using a Mann-Whitney U test. F, a correlation matrix of eight samples made by dCHIP software using >1.2-fold differentially expressed genes between Wt and Ebf1+/− pre-B-cells and between Wt and Ebf1+/− pro-B-cells. The correlation is calculated and visualized by color (red and blue) in the matrix. The data were generated by hybridization of cRNA to AffymetrixTM microarrays and collected from two independently sorted populations. *, p < 0.05; **, p < 0.01; ****, p < 0.0001.

