FIGURE 3.
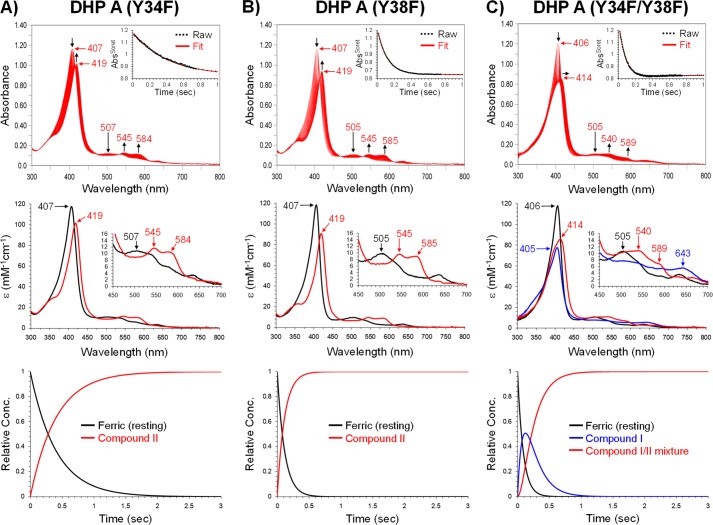
Kinetic data obtained by optical spectroscopy for the DHP A mutants. A, DHP A (Y34F): top panel, stopped-flow UV-visible spectra of DHP A (Y34F) (10 μm) reacting with a 10-fold excess of H2O2 at pH 7.0 (400 scans over 3 s); inset, the single wavelength (407 nm) dependence on time obtained from the raw spectra and its fit with a superposition of the calculated spectra components; middle panel, calculated spectra of the two reaction components derived from the SVD analysis: ferric heme state (black) and Compound II (red); bottom panel, time dependences of the relative concentrations for the three components shown in the middle panel as determined by fitting the spectra set in the top panel. B) DHP A (Y38F), top, middle, and bottom panels are similar to those in A. C, DHP A (Y34F/Y38F): top, middle, and bottom panels are similar to those in A except the calculated spectra derived from the SVD analysis were fit to three reaction components: ferric heme state (black), Compound I (blue), and the “Compound I/II mixture” species (red).

