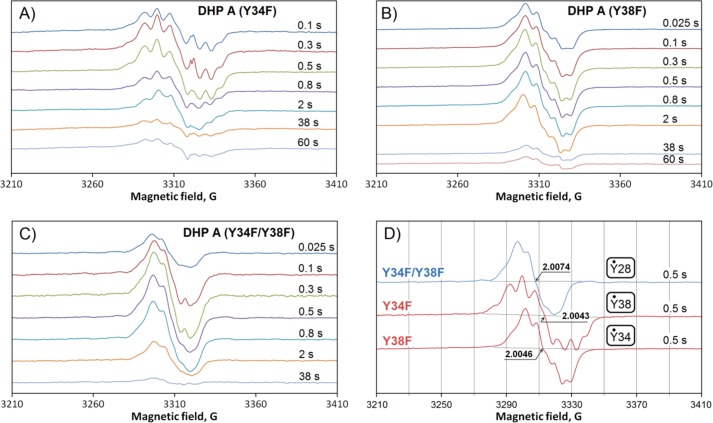
FIGURE 4.
Free radical EPR spectra collected at variable freeze-quench times (indicated) after mixing 50 μm DHP A mutants with 500 μm H2O2 (both concentrations are final): Y34F (A), Y38F (B), Y34F/Y38F (C). D, typical EPR spectra in different mutants are compared. In small boxes are the radicals thought to be responsible for the observed line shapes (see “Discussion”). The reaction was conducted in a 100 mm potassium phosphate buffer (pH 7) at 25 °C.

