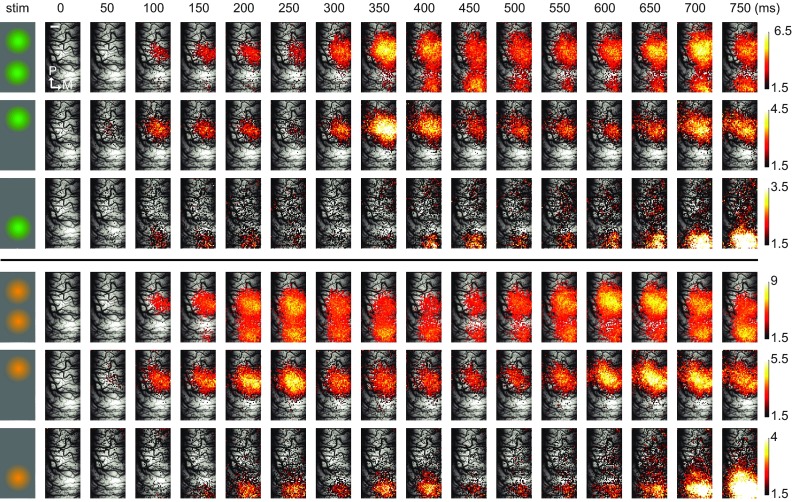
Figure 2. Dynamics of cortical activity evoked by locally presented natural stimuli.
( A) Spatiotemporal activity patterns produced by locally presented natural movies is shown overlaid on the vascular image. Leftmost column schematically shows the corresponding stimulus condition and the movie used ( orange and green). Each single frame represents the average activity across trials (n = 35) within 50 ms of non-overlapping segments of recorded data. The cortical representations of these stimuli were located along the antero-posterior axis, reflecting the vertical positioning of the movie-patches in the visual field. Different spatial extents and peak values of cortical activation were observed along the presentation duration at different frames. Please note that different color-scales are used for different conditions in order to emphasize the detailed spatial structure. Color scale represents ΔF/F (x10 -4). Color scale maximum is set to 3.3 standard deviations of activity levels. Only the most active pixels corresponding to highest 25 th percentile are shown. For a video presentation please refer to the Video S2. Scale bar (shown in the first row in the frame zero) = 1 mm.

