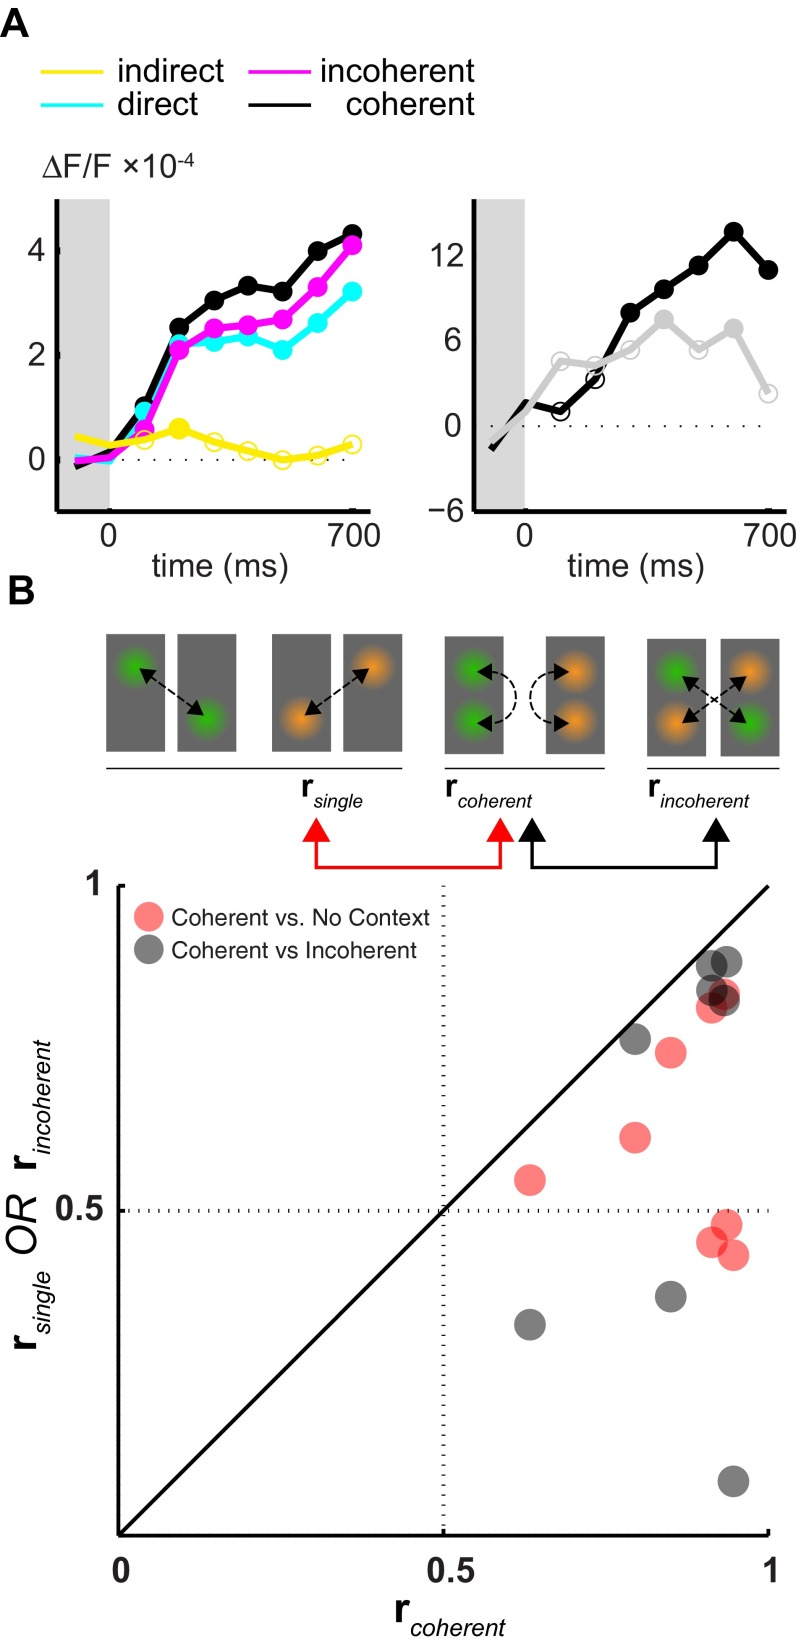
Figure 5. Time-course of contextual interactions.
( A) The temporal evolution of activity in response to indirect ( yellow), direct ( cyan), coherent ( black) and incoherent ( magenta) stimulation ( left panel). Average activity within the regions of interest (depicted in Figure 3) is used. For each temporal window the median across experiments and movies is presented. Median values that are statistically different (sign-rank test, alpha = 0.05) from zero are depicted with filled circles. The pair-wise difference of amplitudes between coherent and single conditions ( black line) as well as between coherent and incoherent ( gray line) conditions is shown in the right panel. ( B) The similarity between the time-courses of activity recorded at two distant regions of interest is evaluated for each movie separately under different conditions (2 dots per experiment). r coherent measures the correlation between two time-courses of activity evoked by the simultaneous presentation of two local movie-patches. r incoherent and r single were computed using the activity evoked by exactly the same input however presented at different conditions (see icons and arrows). The scatter plot depicts the comparison of r coherent to r single and r incoherent.

