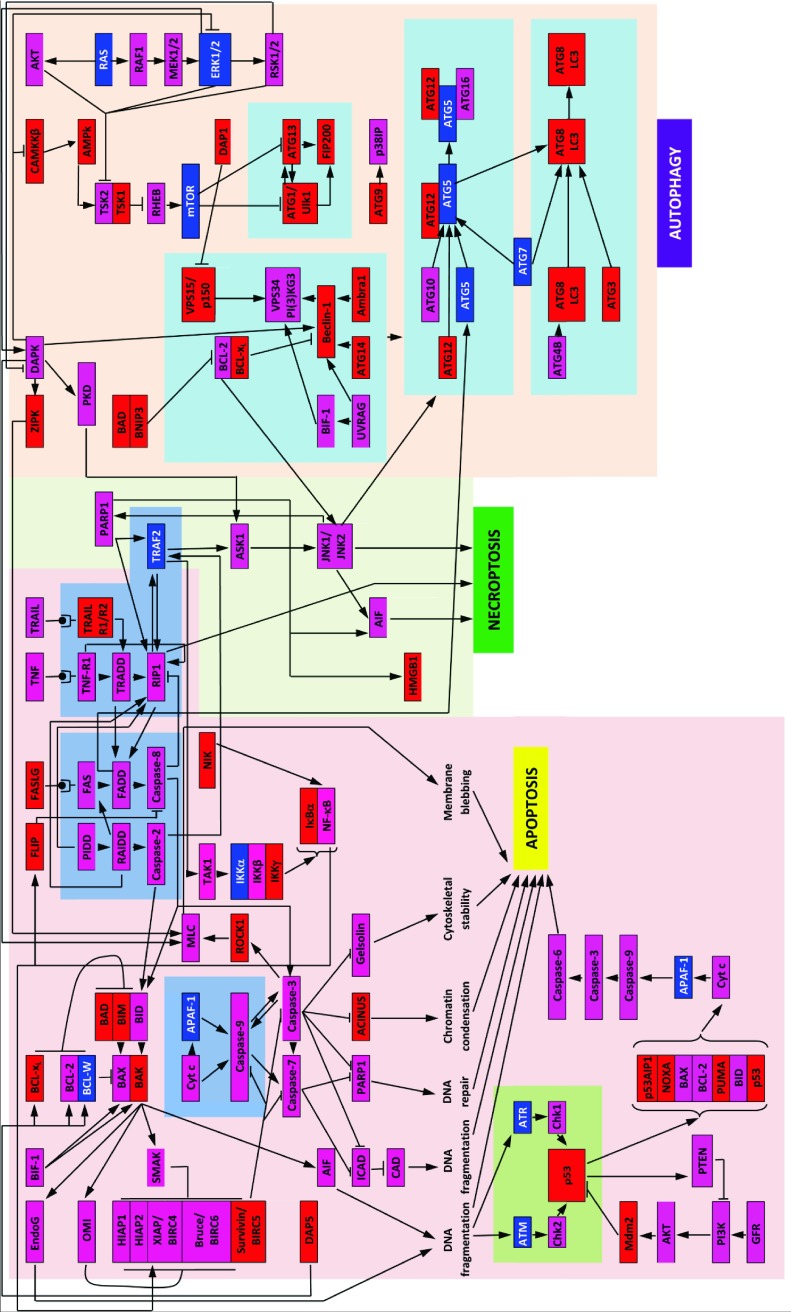
Figure 1. Schematic representation of three PCD modules.
Diagram shows a map of the regulators and molecular components of the apoptosis, autophagy, and necroptosis death pathways, constituting the three known modules of the programmed cell death (PCD) network. The proteins are color coded according to their intrinsic disorder content evaluated by PONDR-FIT, with highly ordered ([IDP score]<10%), moderately disordered (10%≤ [IDP score]<30%), and highly disordered ([IDP score]≥30%) being shown as blue, pink, and red boxes, respectively. This diagram is based on the PCD maps published in 47, 150, 151 and is reproduced from 42.

