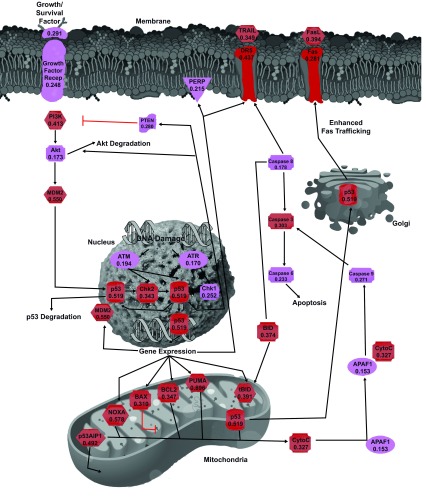
Figure 2. Schematic representation of the p53-mediated apoptotic signaling pathways.
Diagram shows a map of the regulators and molecular components of this pathway. The proteins are color coded according to their intrinsic disorder content evaluated by PONDR-FIT, with highly ordered ([IDP score]<10%), moderately disordered (10%≤ [IDP score]<30%), and highly disordered ([IDP score]≥30%) being shown as blue, pink, and red boxes, respectively. This diagram is based on the maps of the p53-mediated apoptotic signaling pathways available at ( http://www.ebioscience.com/resources/pathways/p53-mediated-apoptosis-pathway.htm) and ( http://www.qiagen.com/Products/Genes and Pathways/Pathway Details/?pwid=338) and on related information 62, 109, 151, 152 and many other papers.

