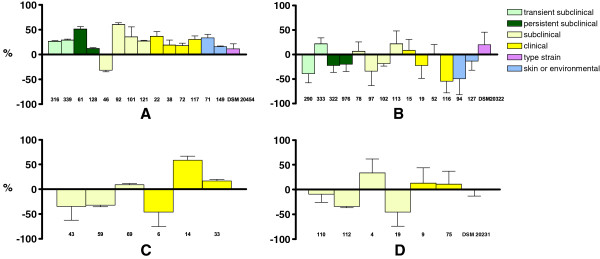
Figure 3.

The mean killing percentages (±SD) of S. chromogenes (A), S. simulans (B), S. agnetis (C) and S. aureus (D) isolates by murine J774 macrophages. Bars indicate the average result ± standard deviation of three separate assays, with two replicates of each sample in a single experiment. The origins of the strains included are marked with different bar colours.
