
FIGURE 1.
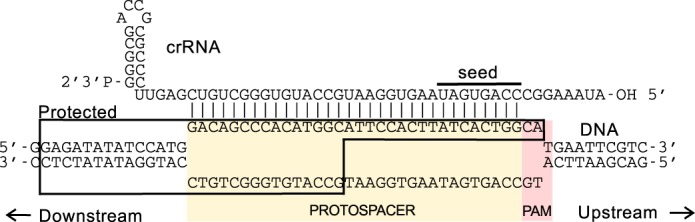
Schematic representation of the R-loop formed between Cascade and DNA target. The positions of the PAM and protospacer are shaded yellow and red, respectively. The location of the seed sequence is also indicated. Outlining delineates the region of the DNA protected in footprinting experiments (6).