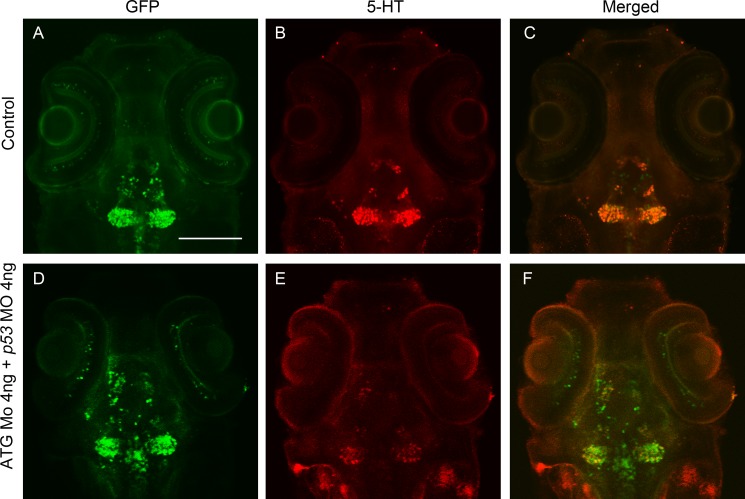
FIGURE 5.
Maximum intensity section of 5-HT in diencephalon and GFP immunoreactivity at 72 hpf shows that the decrease of 5-HT is not caused by cell loss. A dorsal view is shown, anterior to the top. A–C, control embryo; D–F, ATG MO (4 ng) + p53 MO (4 ng) embryo. The intensity of 5-HT in the morphant reduced sharply (E) compared with that of control (B), whereas the intensity of GFP in both groups did not change (A and D). Scale bar, 100 μm.

