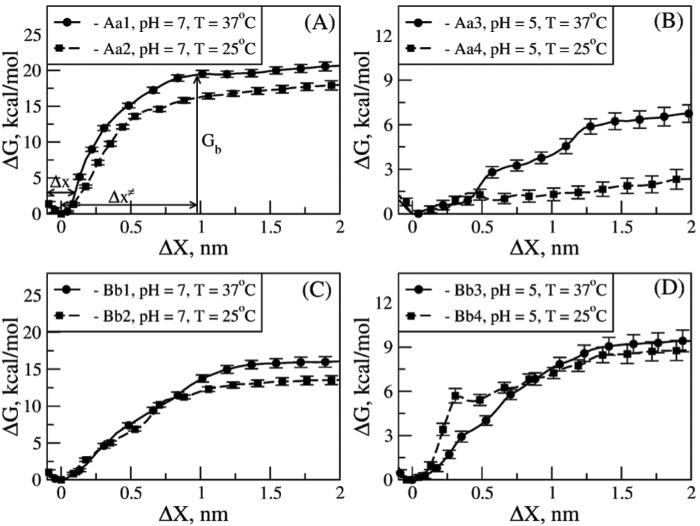
FIGURE 4.
Free energy landscape underlying the thermodynamics of A:a and B:b knob-hole interactions in fibrin. The Gibbs free energy for unbinding, ΔG, for model systems Aa1 and Aa2 (A) and Aa3 and Aa4 (B) and for model systems Bb1 and Bb2 (C) and Bb3 and Bb4 (D) as a function of knob-hole interaction range X are compared for different ambient conditions (at pH 7 and 5 and T = 25 and 37 °C; see supplemental Tables S1 and S2). The standard deviations (error bars) of ΔG are shown. The values of the equilibrium binding energy Gb, the width of the bound state Δx, and the distance between the bound state and transition state Δx≠ shown in A are given in Table 2.

