
FIGURE 5.
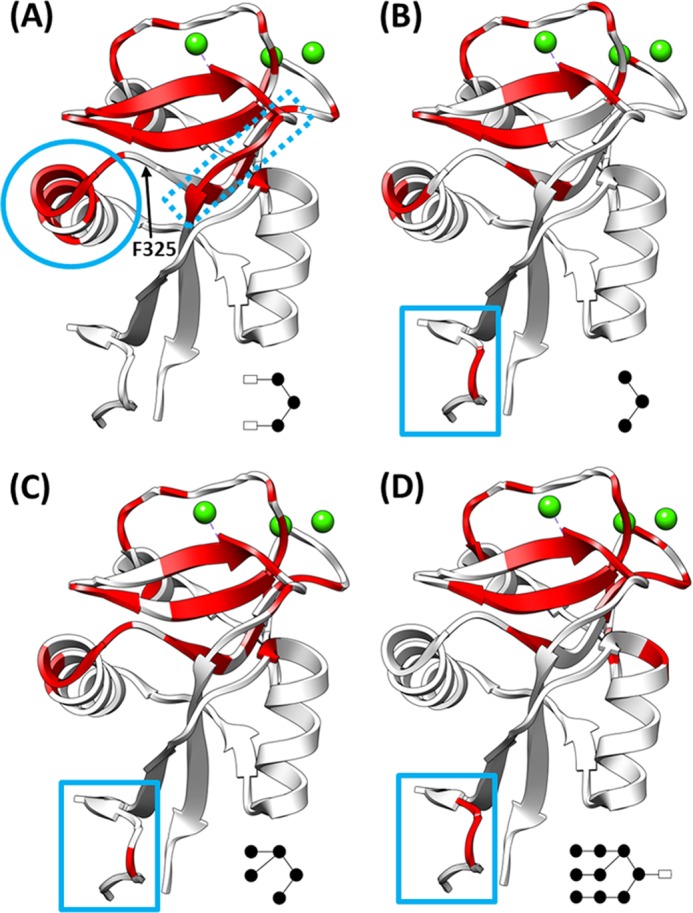
Regions affected by glycan binding. Chemical shifts with perturbations greater than 1 × S.D. upon the addition of 5 mm (GlcNAc)2Man3 (A), Man3 (B), Man5 (C), and Man9GlcNAc (D) are shown in red mapped onto the structure of the (GlcNAc)2Man3·CDR complex (Protein Data Bank code 1K9J). A schematic of the bound glycan is given in the lower right corner of each panel. These maps highlight the conserved binding regions as well as regions unique to each glycan.