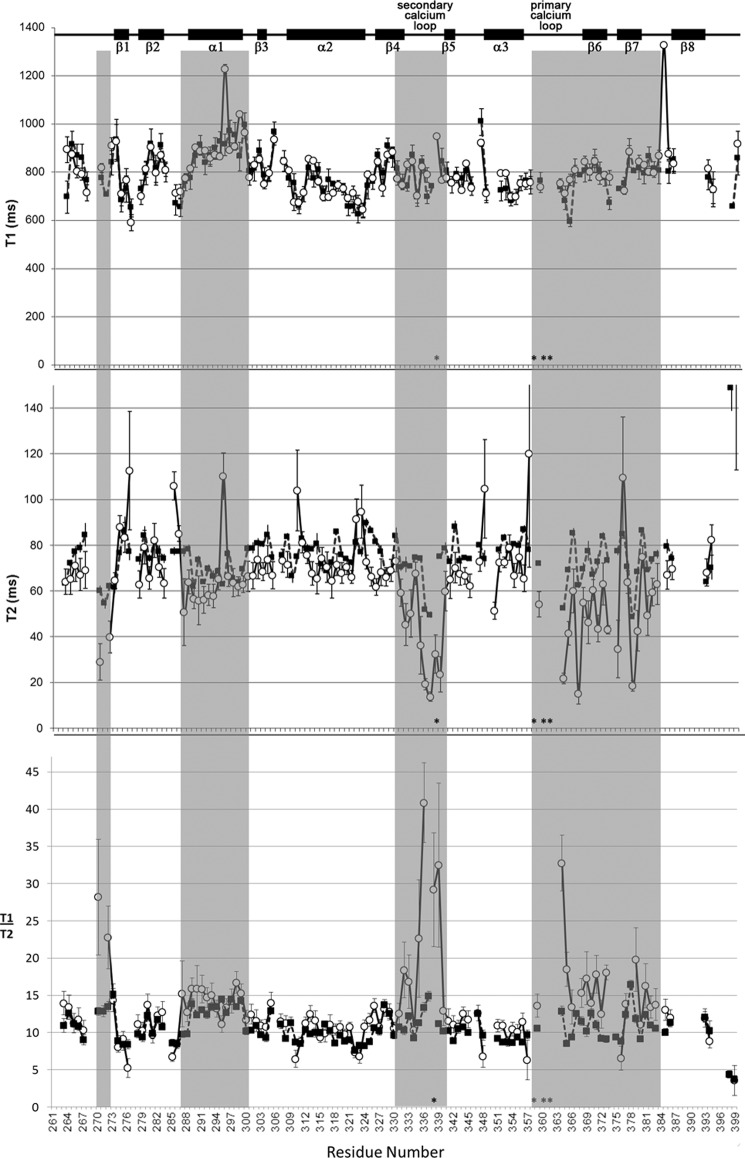
FIGURE 7.
Dynamics of the CRD. Shown is a plot of per residue values for 15N T1 (top), 15N T2 (middle), and 15N T1/T2 (bottom) for holo-DC-SIGNR CRD (solid squares) and Man5-bound (open circles) DC-SIGNR CRD. Asterisks along the bottom of each panel denote residues that are not observed due to fast relaxation or exchange.

