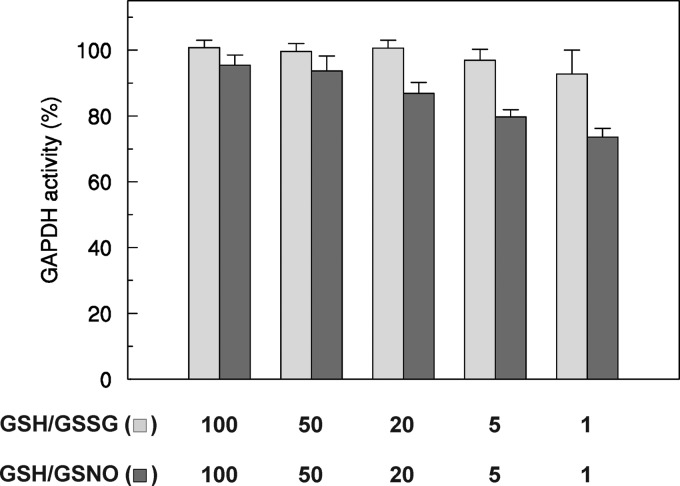
FIGURE 9.
Redox titrations of GAPC1 in the presence of various [GSH]/[GSNO] or [GSH]/[GSSG] ratios. Reduced GAPC1 was incubated in the presence of varying [GSH]/[GSNO] (light gray bars) or [GSH]/[GSSG] (dark gray bars) ratios at a total concentration of 2 mm. After equilibrium in the redox buffers was reached (30 min), the remaining NADH-dependent activity was measured. Data are represented as mean percentage ± S.D. (n = 3) of the initial activity of reduced GAPC1 measured before the treatments.

